
The Manufacturing, Trade, Inventories & Sales for April 2010 is out. Sales were up 0.6% and inventories up 0.4% for the month. Last month sales were up 2.5% for all business.
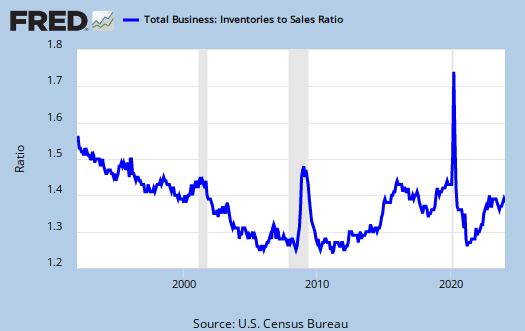
Below is a graph of the sales to inventories ratio. As you can see the ratio has become flat, which implies businesses are simply keeping on hand what they believe they can sell. It represents only a 1.23 months supply of inventories, given the current sales rate.
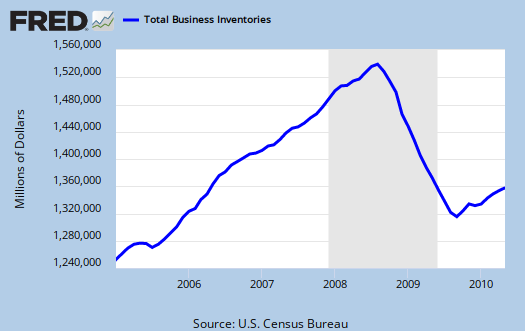
Below is a graph of raw inventory changes. Notice inventories are nowhere near pre-recession levels.
Here is the percentage change.
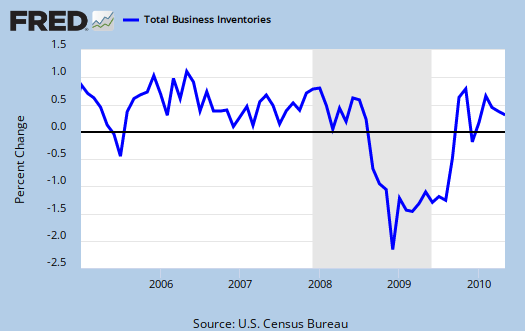
In both Q4 2009 GDP as well as Q1 2010 GDP, the change in inventories and the rate of that change is what created positive GDP growth. Inventory changes were 64% of Q4 2009 GDP growth and 55% for Q1 2010 GDP.
While one might see some spin on these numbers, notice the lower sales rate and the low inventories growth rate, implying businesses do not foresee a sudden increase in future sales. Bottom line, don't expect anymore blow out GDP numbers, especially considering the other economic indicators including today's retail sales. The inventory roller coaster free ride appears to be over. We're not seeing other areas, such as exports, PCE (consumers buying stuff) or investment taking up the slack on GDP.
Recent comments