
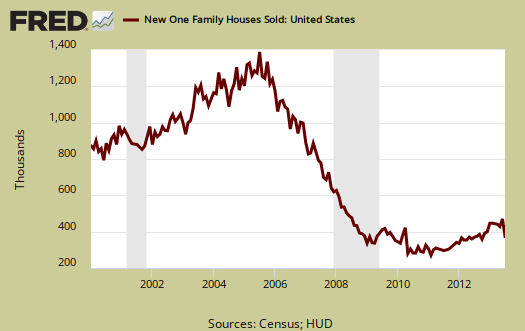
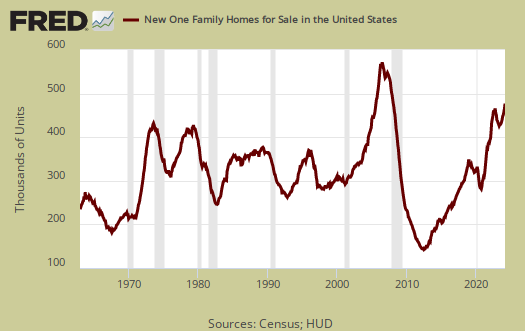
July 2013 New Residential Single Family Home Sales plunged -13.4% to 394,000 in annualized sales and April through June were significantly revised lower. New Single Family Housing inventory is now a 5.2 month supply. New single family home sales are now 6.8% above July 2012 levels, but this figure is well within the ±18.6% margin of error. A year ago new home annualized sales were 369,000. Sales figures are annualized and represent what the yearly volume would be if just that month's rate were applied to the entire year. These figures are seasonally adjusted as well.
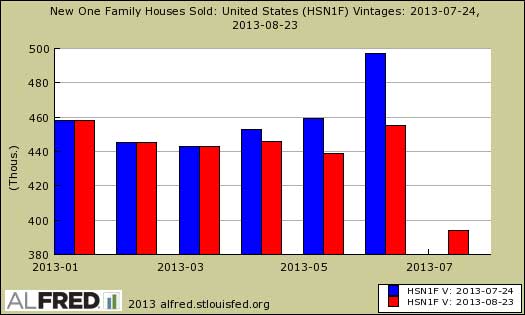
The real bad news on new home sales are the revisions, although large revisions should be no surprise with this large of a error margin, along with the fact data is presented annualized. Below is a graph showing single family new home sales levels as reported in July, in red, against the against June's reported figures in blue. April through June were all revised significantly lower, with June's single family annualized sales now at 455,000, a far cry from the 497,000 originally reported.
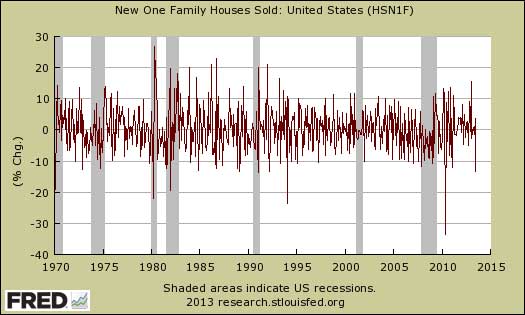
The monthly change is well within the statistical error margin of ±14.5%. To show how absurd it is for Wall Street to go nuts over new home sales monthly percentage changes, below is a graph of those monthly percentage changes. As we can see this statistic is incredibly noisy and the below graph tells us nothing about new home sales by looking at the month to month percentage change.
Prices are just getting to be absurd and note how increasing prices are not being recognized for a slow down in sales by the press. The average home sale price was $322,700, a 14.3% increase from a year ago. These prices are still clearly outside the range of what most wages can afford, even with low mortgage rates In July 2012, the average home sale price was $282,300. Just recently it was reported the average home price in Silicon valley is now over $1 million. Imagine working in that area and trying to live without being a millionaire.

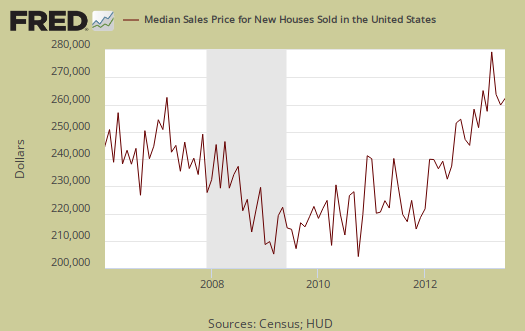
July's median new home price is also high, $257,200. From Jule 2012, the median new home sales price has increased by 8.3%. Median means half of new homes were sold below this price and both the average and median sales price for single family homes is not seasonally adjusted.
Inventories: New homes available for sale were 171,000, a 20.4% increase from a year ago.
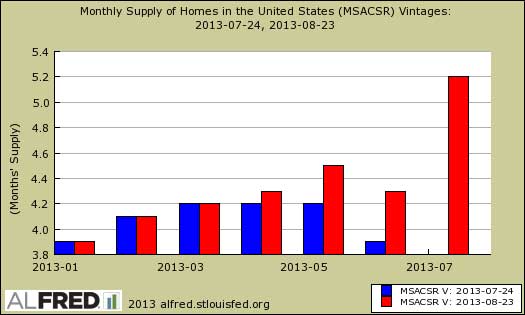
Below is a graph of the months it would take to sell the new homes on the market at each month's sales rate, currently at 5.2 months We can see these inventories vs. sales times have plunged as an overall trend.

Yet the months to sell new homes also was significantly revised upward. Below is a graph showing the previous estimates, in blue, against the new time to sell existing inventory at current sales rates, in red. This almost negates a host of analysis for the past year on how inventories were so low new homes were just flying off the shelves. With these revisions, the time it would take to sell a new home just increased 13.0% from a year ago.
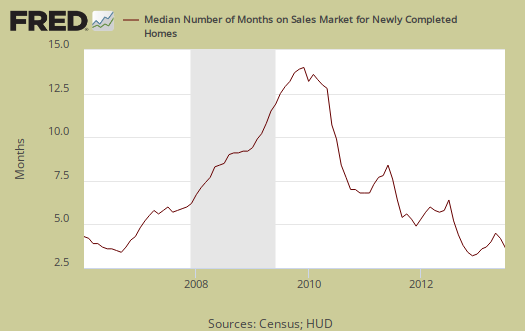
The median time a house was completed and on the market for sale to the time it sold was 3.9 months. The median time a house was completed and then sold has also plunged as an overall trend. The median time a home was on the market in July 2012 was 6.4 months.
The variance in monthly housing sales statistics is so large, in part, due to the actual low volume overall, along with the fact this is a survey. One needs to look at least a quarter to get a real feel for new home sales, but a year of sales data is more in order. Additionally this report, due to it's huge margin of error, is almost always revised significantly the next month. Buyer beware on month to month comparisons and reacting to primarily figures and why we graph up the statistics so one can identify a real trend versus press headline buzz and the above revisions, as dramatic as they are, is not unusual. We list the margins of error for they are usually above the monthly reported percentage changes. The Census notes that the average revision is about 5% of the original reported.
What we know for certain is new homes sales are increasing as a trend and the costs are skyrocketing. New single family home prices becoming out of reach for most families by income once again. This is not a healthy housing market to simply return to new home prices people cannot afford and is one of the reasons subprime started in earnest a decade ago.
Finally, there are those in the press who once again, incorrectly, are trying to claim this report would influence the Federal Reserve to continue asset purchases, otherwise known as quantitative easing. That's just wrong. The Federal Reserve is not there to hype up the housing market. This report also has a large error margin. Additionally new home sales are a small part of overall economic growth and thus the FOMC would not base their asset purchase tapering timeline on it.
Here is our overviews of residential real estate statistics, only some graphs revised.
a lot of downward revisions...
there were sizable downward revisions to previous months data in June as well; here's what i wrote last month:
Before the adjustment and extrapolation, the actual estimate of new homes sold in June was 48,000; which was up from the revised May estimate of 43,000, which in turn was reported last month as 45.000 homes sold, resulting in a 17,000 downward revision in the annualized May rate....April's estimated sales were also revised down, from the 46,000 revised figure of last month to 44,000, while March sales were revised down from the earlier estimate of 42,000 to 41,000, meaning the net downward revisions in this report were as great as the headline sales gain, which many trumpeted as the highest level of sales in 5 years ...
rjs
revisions on new home sales
These are larger than most and the reason for graphing up the before and after. Clearly the housing market volume isn't as great as claimed but the prices are now unaffordable.
Notice that NAR for pending home sales barely revises and does not announce those revisions, Case Shiller same.