
Pending Home Sales declined in June by -1.4%, annualized according to the National Association of Realtors. This is 9.5% higher than a year ago. May pending home sales was revised down to 5.4% from the originally reported 5.9% increase.
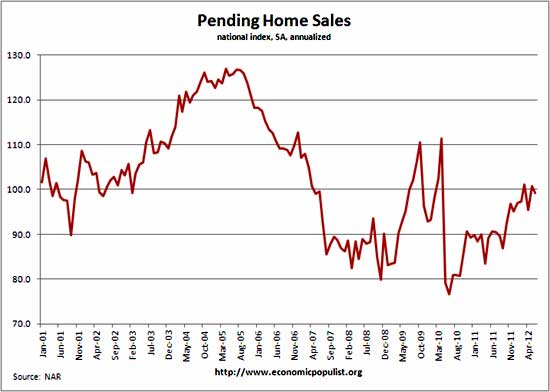
The above graph shows pending home sales are really around 2002 levels, ignoring the housing bubble itself and the tax credits of 2009. Last month the NAR claimed home sales would increase 10%. We thought that was a pipe dream and this month's statistics seem to reflect the smoke NAR is continually blowing on residential real estate's magic recovery.
The PHSI are contracts which have not yet closed and why pending home sales are considered a future housing indicator. The PHSI represents future actual sales, about 45 to 60 days from signing. From the NAR:
NAR's Pending Home Sales Index (PHSI) is released during the first week of each month. It is designed to be a leading indicator of housing activity.
The index measures housing contract activity. It is based on signed real estate contracts for existing single-family homes, condos and co-ops. A signed contract is not counted as a sale until the transaction closes. Modeling for the PHSI looks at the monthly relationship between existing-home sale contracts and transaction closings over the last four years.
Here are the regional pending home sales from the report:
The PHSI in the Northeast fell 7.6 percent to 76.6 in June but is 12.2 percent higher than a year ago. In the Midwest the index slipped 0.4 percent to 94.4 in June but is 17.3 percent above June 2011. Pending home sales in the South declined 2.0 percent to an index of 106.2 in June but are 8.8 percent above a year earlier. In the West the index rose 2.6 percent in June to 111.5 and is 3.0 percent higher than June 2011.
Once again the NAR is smokin' crack. Literally they claim housing starts will increase 50% by 2014.
Housing starts will likely need to double over the next two years to satisfy the pent-up demand for both rentals and ownership.
I guess if one keeps saying something long enough, eventually it will hit, but we see nothing to indicate a 50% increase in housing starts.
NAR also reports high demand for mortgages causing delays. O'Rly. Freddie Mac's June mortgage volume was -2.5% down in June, annualized with about 70% of that volume being refinancing. Single family delinquencies were 3.45% whereas apartment delinquencies upticked to 0.27%.
According to RealtyTrac, foreclosure starts may have dropped 4% from May to June, but are up 9% for Q2 2012 in comparison to Q1 2012.
We do know foreclosures, REOs are being held off of the market. Estimates range from 80-90% of all REOs (bank owned properties) are actually shadow inventory, not being put on the market for sale, and is a major reason housing inventories are so low.
Mortgage rates hit record lows, 3.49%, but lending standards are absurd, with unscrupulous debt collectors being allow to ruin FICO scores over very small and unverified debts, mostly medical bills. Here is one area the NAR might be onto something, the claim lending standards are too tight.
Bottom line, it's difficult to even cover NAR statistics, the comments are almost always out of alignment with other housing reports and general market conditions. We believe the actual pending home sales statistics are accurate at least.
Here is last month's pending home sales overview, unrevised.
Recent comments