
The GDP initial estimate reports a solid 2.9% economic growth for the third quarter. Trade exports and private inventories accelerated in Q3. Consumer spending was home hum, although durable goods consumer spending dramatically increased. Residential investment declined for the quarter. While a nice report, GDP is always revised and this is just the initial release. We don't believe Q3 GDP is the knock out some in the press are proclaiming.

As a reminder, GDP is made up of: where Y=GDP, C=Consumption, I=Investment, G=Government Spending, (X-M)=Net Exports, X=Exports, M=Imports*. GDP in this overview, unless explicitly stated otherwise, refers to real GDP. Real GDP is in chained 2009 dollars.
The below table shows the GDP component comparison in percentage point spread from Q4 to 2016 Q1. If one recalled Q4 initially came in at 0.7%, yet don't expect a repeat revision performance. There are always two revisions after the initial quarterly GDP report release. There will also be annual revisions in July going back three years.
| Comparison of Q3 2016 and Q2 2016 GDP Components | |||
|---|---|---|---|
|
Component |
Q3 2016 |
Q2 2016 |
Spread |
| GDP | +2.91 | +1.42 | +1.49 |
| C | +1.47 | +2.88 | -1.41 |
| I | +0.52 | -1.34 | +1.86 |
| G | +0.09 | -0.30 | +0.39 |
| X | +1.17 | +0.21 | +0.96 |
| M | -0.34 | -0.03 | -0.31 |
Consumer spending, C was almost half of what it was in Q2. Below is a percentage change graph in real consumer spending going back to 2000.
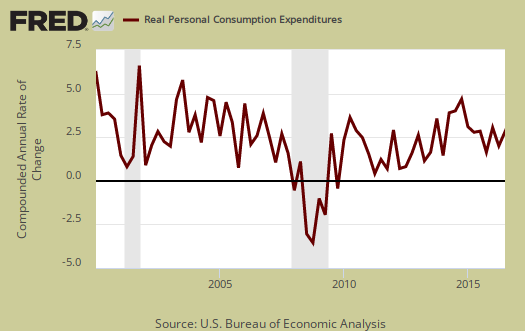
Goods spending was a full percentage point less than Q2, 0.48 percentage points of contribution. Durable goods were 0.69 percentage points, a healthy showing while nondurable goods was a -0.21 percentage point contribution. Services were a 0.99 percentage point contribution. Within services, health care was a 0.27 percentage point contribution to Q3 GDP, housing and utilities was 0.30 percentage points and gross output of nonprofit institutions contributed 0.23 percentage points to GDP growth. Graphed below is PCE with the quarterly annualized percentage change breakdown of durable goods (red or bright red), nondurable goods (blue) versus services (maroon).

Imports and Exports, M & X dramatically improved with a 0.83 percent point contribution. This is the advance GDP estimate, hence actual trade data hasn't come in yet and imports are almost always revised upward, even with petroleum imports declining as a trend. Right now exports by themselves contributed over a percentage point to GDP and we just think that will be eaten up by imports upon revision. The next revision release is next month.

Government spending, G contributed almost nothing, 0.09 percentage points to Q3 GDP. Federal spending was 0.17 percentage points while state and local subtracted -0.08 percentage points. Government spending has been an absentee player for quite some time in GDP growth.

Investment, I is made up of fixed investment and changes to private inventories. The change in private inventories alone was a +0.61 percentage point contribution. In Q1, changes in private inventories subtracted -1.16 percentage points from Q2 GDP. So, the end of private inventories accelerated shrinking really helped Q3 growth. Below are the change in real private inventories and the next graph is the change in that value from the previous quarter.


Fixed investment is residential and nonresidential and was a wash with a -0.09 percentage point GDP contribution. Nonresidential was a 0.15 individual percentage point contribution Within nonresidential, structures added 0.14 percentage points from GDP and equipment was shorn by -0.16 GDP percentage points. Equipment was negative due to a -0.26 percentage point contribution by transportation equipment.

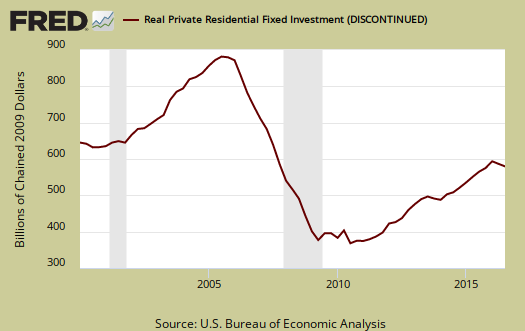
Residential fixed investment was not good for Q3 with a -0.24 percentage points to GDP. The below graph shows residential fixed investment.
Nominal GDP: In current dollars, not adjusted for prices, of the U.S. output,was $18,651.2 billion, a 4.4% annualized increase for Q2 from Q3. In Q2, current dollar GDP increased 3.7%, showing how inflation has impacted real GDP for both quarters.

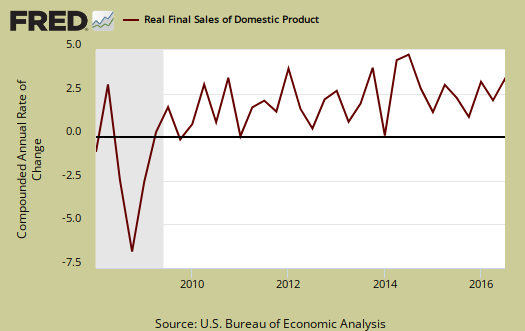
Real final sales of domestic product is GDP - inventories change. This figures gives a feel for real demand in the economy. This is because while private inventories represent economic activity, the stuff is sitting on the shelf, it's not demanded or sold. Real final sales increased 2.3%, which is reasonable growth.
Gross domestic purchases are what U.S. consumers bought no matter whether it was made in Ohio or China. It's defined as GDP plus imports and minus exports or using our above equation: where P = Real gross domestic purchases. Real gross domestic purchases increased 2.0% in Q2. Exports are subtracted off because they are not available for purchase by Americans, but imports are available for purchase in the U.S. When gross domestic purchases exceed GDP, that's actually bad news, it means America is buying imports instead of goods made domestically.

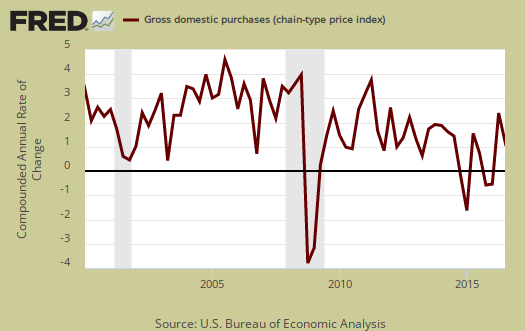
The price index for gross domestic purchases increased 1.6% for Q3. Without food and energy considered, the core price index increased 1.7%. In Q2 the price index was 2.1% and without food and energy considered, 2.0%. The Federal Reserve's target inflation rate is about 2.0% without food and energy considered.
Below are the percentage changes of the Q3 2016 GDP components, from Q2. There is a difference between percentage change and percentage point change. Point change adds up to the total GDP percentage change and is reported above. The below is the individual quarterly percentage change, against themselves, of each component which makes up overall GDP. Additionally these changes are seasonally adjusted and reported by the BEA in annualized format. Durable goods by themselves showed a 9.5% increase. Within investment structures showed a 5.4% increase. Residential investment on the other hand showed a -6.2% quarterly decrease.
|
Q3 2016 GDP Component Percentage Change (annualized) |
|||
|---|---|---|---|
| Component | Percentage Change from 2015 Q4 | ||
| GDP | +2.9% | ||
| C | +2.1% | ||
| I | +3.1% | ||
| G | +0.5% | ||
| X | +10.0% | ||
| M | +2.3% | ||
This GDP report is OK, but not the raging growth so many in the press implied. The fact so much of growth was on trade is not a good thing as trade data is so often revised dramatically The better news is how inventory contraction acceleration has stopped. The halving of consumer spending might be a concern except this month's report showed a comeback.
Other overviews on gross domestic product can be found here. The BEA GDP site is here.
Recent comments