
Q4 GDP 2011 came in at 2.8%.. Here is the original BEA GDP report. Q3 2011 GDP remained the same at 1.8%. Real GDP for 2011 is 1.7% for the year. 2010 saw a 3.0% real increase in GDP. Quarterly GDP is reported annualized.
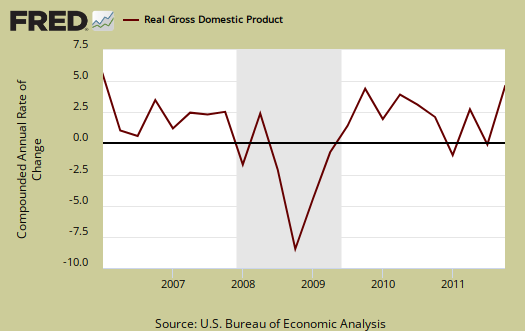
Q4 GDP saw an sharp increase in private inventories build up, part of investment, and a decrease in government spending. Personal consumption also increased as did imports.
As a reminder, GDP is made up of:
where Y=GDP, C=Consumption, I=Investment, G=Government Spending, (X-M)=Net Exports, X=Exports, M=Imports*.
Here is the Q4 2011 advance report breakdown of GDP by percentage point contributions. The BEA rounds to one decimal place, Q4 GDP was actually 2.76%
- C = +1.45
- I = +2.35
- G = –0.93
- X = +0.64
- M = –0.75
Here is the Q3 2011 report, with the latest revisions, breakdown of GDP by percentage point contributions. Without rounding, Q3 GDP was 1.82%.
- C = +1.24
- I = +0.17
- G = –0.02
- X = +0.64
- M = –0.21
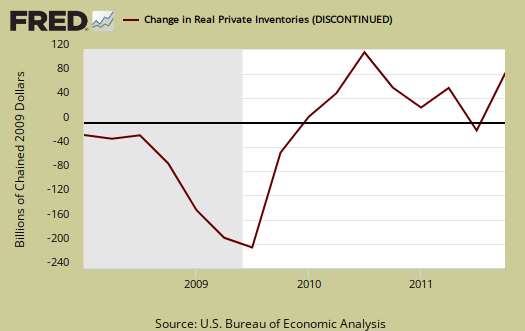
Below are the percentage point differences, or spread between the Q4 advance and Q3 2011 GDP report components. This represents the change of gross domestic product growth contributions from Q3 to Q4. The quarterly change in private inventories was a +3.29 spread and trade was a -0.54 point spread.
- C = +0.21
- I = +2.18
- G = -0.91
- X = 0.00
- M = -0.54
Changes in private inventories added +1.94 percentage points to Q4 2011 2.76% GDP, or 70.3%. Companies increase inventories when they believe demand for their products will be picking up. Inventories can also build up when producers made more stuff they thought would sell.....but didn't. Hello retail sales Christmas hype.
Yes folks, government consumption and investments does add to U.S. economic growth in spite of the rhetoric one hears. This quarter government subtracted off -0,93 percentage points, or -25.2% from Q4's GDP. Federal spending subtracted off –0.62 percentage points and State spending resulted in a negative –0.32 percentage point contribution to GDP. Federal national defense spending was the biggest drop, with a –0.73 percentage point GDP contribution. Below is the percentage quarterly change of government spending, adjusted for prices, annualized.

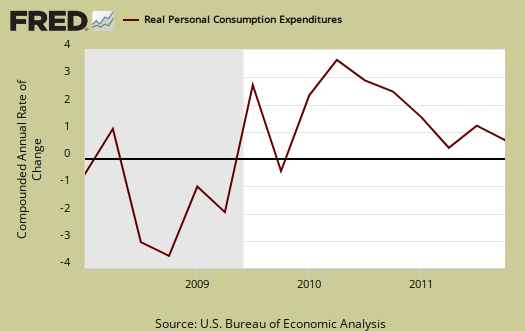
Below the the St. Louis FRED graph for C, or real personal consumption expenditures of the above GDP equation. As we can see from the above, PCE, or C in the above equation, wasn't the real reason for stronger GDP growth in Q4.
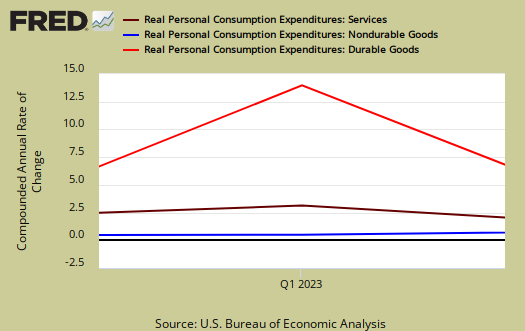
Below is the breakdown in C or real PCE annualized change. The forth quarter PCE percentage point breakdown was only a +0.10 percentage point contribution in services, goods was +1.34 with durable goods being most of goods, or a +1.07 percentage point contribution to GDP. Notice when times are tough, durable goods (bright red) consumption drops. Where people spent their money was motor vehicles and parts, a +0.81 percentage point contribution to GDP. Housing and utilities was –0.40 percentage points of Q4 GDP and yes these are adjusted for inflation using CPI. In real dollars housing and utilities were consumed less in Q4. PCE is often revised from the advance report as receipts and reports are collected. Below is PCE with the breakdown of goods versus services.
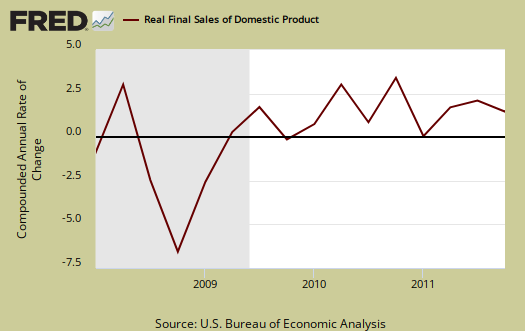
Below are real final sales of domestic product, or GDP - inventories change. This gives a better feel for real demand in the economy. This is because while private inventories represent economic activity, the stuff is sitting on the shelf, it's not demanded or sold. Real final sales the the bad news of this GDP release, it shows real demand increased only 0.8% for Q4. In Q3 real final sales was 3.2%.
Below are net exports, or the trade deficit, in real chained dollars, for Q4 2011. Imports subtract from gross domestic product.
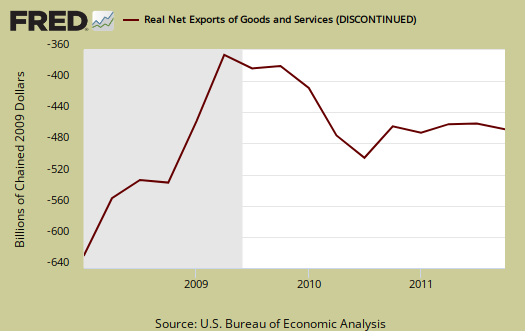
The below graph shows real imports vs. exports. Exports increased 4.7% from last quarter, the same as Q3 growth by percentages. Yet imports soared. Imports increased by 4.4% in Q4, in comparison to a 1.2% increase in Q3. It is the trade deficit that matters for GDP. Additionally imports are almost always revised from the advance GDP report as Census trade data comes in from customs.

Gross domestic purchases are what U.S. consumers bought no matter whether it was made in Ohio or China. It's defined as GDP plus imports and minus exports or using our above equation: where P = Real gross domestic purchases. Real gross domestic purchases increased 2.8% in Q4 in comparison to 1.3% in Q3. Exports are subtracted off because they are outta here, you can't buy 'em, but imports, as well a know all too well, are available for purchase at your local Wal-mart. When gross domestic purchases exceed GDP, that's actually bad news, it means America is buyin' imports instead of goods made domestically.
Below are the percentage changes of Q4 2011 GDP components in comparison to Q3. Realize there is a difference between percentage change and percentage point change. Point change adds up to the total GDP percentage change and is reported above. The below is the individual quarterly percentage change, against themselves, of each component which makes up overall GDP.
- C = +2.0%
- I = +20.0%
- G = –4.6%
- X = +4.7%
- M = +4.4%
The BEA's comparisons in percentage change breakdown of 2nd quarter GDP components are below. Changes to private inventories is a component of I.
C: Real personal consumption expenditures increased 2.0 percent in the fourth quarter, compared with an increase of 1.7 percent in the third. Durable goods increased 14.8 percent, compared with an increase of 5.7 percent. Nondurable goods increased 1.7 percent, in contrast to a decrease of 0.5 percent. Services increased 0.2 percent, compared with an increase of 1.9 percent.
I: Real nonresidential fixed investment increased 1.7 percent in the fourth quarter, compared with an increase of 15.7 percent in the third. Nonresidential structures decreased 7.2 percent, in contrast to an increase of 14.4 percent. Equipment and software increased 5.2 percent, compared with an increase of
16.2 percent. Real residential fixed investment increased 10.9 percent, compared with an increase of 1.3 percent.X & M: Real exports of goods and services increased 4.7 percent in the fourth quarter, the same increase as in the third. Real imports of goods and services increased 4.4 percent in the fourth quarter, compared with an increase of 1.2 percent in the third.
G: Real federal government consumption expenditures and gross investment decreased 7.3 percent in the fourth quarter, in contrast to an increase of 2.1 percent in the third. National defense decreased 12.5 percent, in contrast to an increase of 5.0 percent. Nondefense increased 4.2 percent, in contrast to a
decrease of 3.8 percent. Real state and local government consumption expenditures and gross investment decreased 2.6 percent, compared with a decrease of 1.6 percent.
Motor Vehicles added +0.30 percentage points to Q4 real GDP while computer final sales added +0.18 percentage point changes. This is different from personal consumption, or C auto & parts. Motor vehicles, computers are bought as investment, as fleets, in bulk, by the government and so forth.
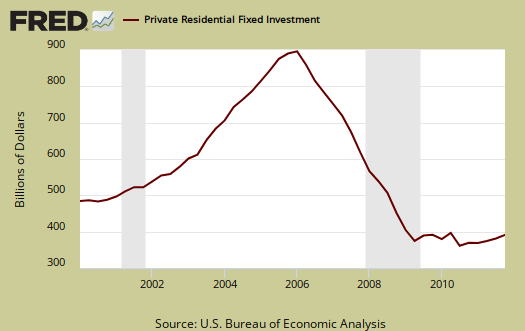
Residential fixed investment added +0.23 percentage points to Q4 GDP after adding a paltry +0.03 percentage points in Q3. While meager, it's still surprising since residential fixed investment has been D.O.A.. Below is the raw totals on residential investment. If one could ever see the housing bubble and then it's collapse in terms of economic contributions, the below graph is it.
Private, or not from the government, nonresidential fixed investment was subdued with only a +0.18 percentage point contribution to Q4 GDP. Structures subtracted –0.21 percentage points from GDP while equipment and software added +0.39 percent points.

Since the GDP report is in real chained 2005 dollars, one might notice the price index used for Q4 is much less than Q3. In other words, less inflation, more real value in comparison to the previous quarter.
The price index for gross domestic purchases, which measures prices paid by U.S. residents, increased 0.8 percent in the fourth quarter, compared with an incr ease of 2.0 percent in the third. Excluding food and energy prices, the price index for gross domestic purchases increased 1.0 percent in the fourth quarter, compared with an increase of 1.8 percent in the third.
In current dollars, not adjusted for prices, GDP, or the U.S. output, is $15.2943 trillion, an increase of 0.78% from Q3. If annualized, Q4 GDP increased 3.2% and the annualized percentage change in nominal GDP from Q2 to Q3 was 4.4%. Applying the price indexes, or chained, real 2005 dollars, Q3 was $13.3316 trillion and Q4 GDP was 13.4224 trillion.

Here are the overview for the Q3 2011 GDP, 3rd revision report, unrevised.
* In Table 2, the BEA reports GDP contribution components with their equation sign. If durable goods for example, decreased over the quarter or year, it is reported as a negative number. Imports, from the GDP equation, are already a negative for that is not something produced domestically. A negative sign implies imports increased for the time period and a + sign means the change in imports decreased. Or, from the GDP equation: . Confusing but bottom line exports add to economic growth, imports subtract.
GDP overview
Folks, I hope people share this. I have seen so many articles on GDP and this one is right. Other's focus in on PCE and that's NOT the story for Q4, government spending dropped almost an entire percentage point from GDP and then we also have an unexpected inventory build up. Both of these are significant and few in the MSM are paying too much attention.
I read it to the end, Bob.
This analysis of GDP is not found elsewhere and must be read.
Burton Leed
Thank You! I try!
That's why I do these things, these economic report overviews. I'm not sure I bridge that well to explaining what the numbers say to people who don't want to follow the numbers but I know one huge thing, most in the financial press get these report overviews wrong most of the time. All of them do not go into this level of detail, no graphs (Thank you St. Louis FRED dev. team).
So, when this was released we saw a flurry of headlines on how consumer spending wasn't so hot, when that's not the story here. It is why did inventory build up accelerate so much and the second story proves these austerity freaks just do not get how government spending is economic activity and spawns growth. This month's decline really spells that out, the role of government spending in the economy.
A final story is imports. I can almost guarantee those numbers will increase and lower GDP on the 2nd revision. Trade data comes in slowly but it's pretty clear imports have increased (not adjusted for prices) by the monthly trade data.
That inventory acceleration, which can show future economic demand picking up, I don't think so, I think it's a huge miss in what they thought demand would be right now......so that's very bad news for 2012 GDP if that is true.
I'll try to monitor the inventory month data reports so we can get a feel for what's happening here.