
The BLS released real earnings and wages. This is hourly and weekly earnings where inflation has been removed. It gives the real purchasing power of wages relatively over time as well as shows if wages have kept up with inflation.
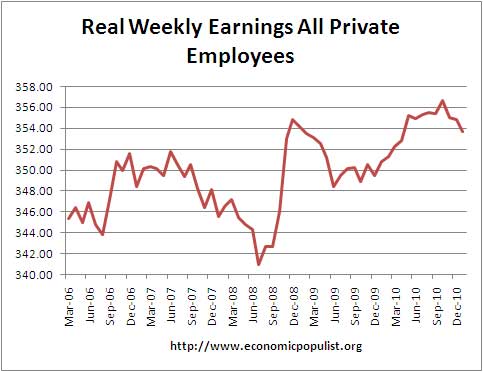
The above graph is all private, nonfarm payroll real weekly wages. Notice that jump in real weekly wages in late 2008. This is when gas prices finally came down from their speculative bubble highs of over four dollars a gallon.
This month weekly earnings declined 0.3% due to a decline in 0.1 hours per week, from December,as well as the increase in inflation. For the year, it's slightly better:
A 0.6 percent increase in average weekly hours combined with the increase in real average hourly earnings resulted in a 0.8 percent increase in real average weekly earnings during this period.
The average weekly earnings was overviewed for there are multiple ways to pay workers less per week. One is to lower their hourly wage but another is to cut their hours.
The weekly wages more reflects what Americans are putting in their pocket and how much they really have to pay their bills and make rent.
There are two categories reported by the BLS. All private, nonfarrm employees, which includes everybody in the company and then a second category, which could be called the worker bees, or the non-management, non-supervisory, people. This group makes up roughly 80% of all private, nonfarm employees. The numbers come from the CES survey. This means it's payroll, so one could have one worker bee be working 2 or even 3 of these jobs. In fact, 4.9% of workers are holding down at least 2 jobs. Here is the report's definition of this subgroup:
Data relate to production employees in mining and logging and manufacturing, construction employees in construction, and nonsupervisory employees in the service-providing industries. These groups account for approximately four-fifths of the total employment on private nonfarm payrolls.
Worker bee weekly wages dropped 0.2% from December to January, due to a slight increase in hours and the increase in CPI (inflation). For the year, average weekly wages has increased 0.7%.
Below is a graph going back to 1964 for the worker bees or production and non-supervisory, private, nonfarm, payrolls.
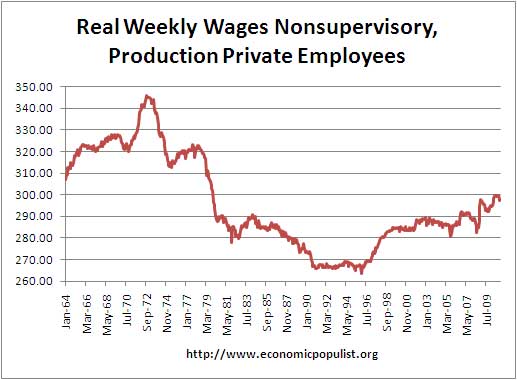
What this shows is after the 1970's, wages never caught up to inflation or the purchasing power of that time period and before. So, next time you see those films from the 1950's showing the great American Dream, this is where the American dream went. Less of the American pie slice is going to U.S. workers.
Recent comments