
May 2012 Retail Sales decreased, by -0.2%, mainly due to dropping gas prices. Minus autos & parts, retail sales also decreased, -0.4%. April retail sales were revised down from 0.1% to -0.2%. May Retail sales are up 5.3% from the same time last year. Retail sales are reported by dollars, not by volume, so dropping prices often reports as a decline in sales.
For the quarter, March to May, retail sales increased 5.7% from the same time period one year ago. Online shoppin' is booming. Nonstore retail sales, which includes online shopping, are up 12.4% from a year ago. Autos are doing well also, with their sales up 10% from this time last year.
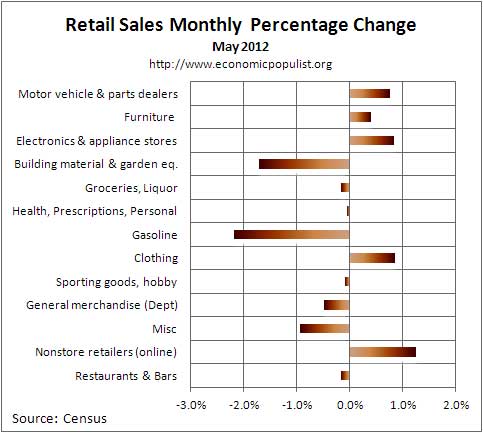
Total retail sales are $404.6 billion for May. April was revised down, from $408 billion to $405.2 billion. Below is the monthly percentage change of retail sales categories. These numbers are seasonally adjusted. Department stores, part of general merchandise, inclined 0.2% for the month.
Retail trade sales are retail sales minus food and beverage services. Retail trade sales includes gas, and is down -0.2% for the month, up 5.0% from last year.
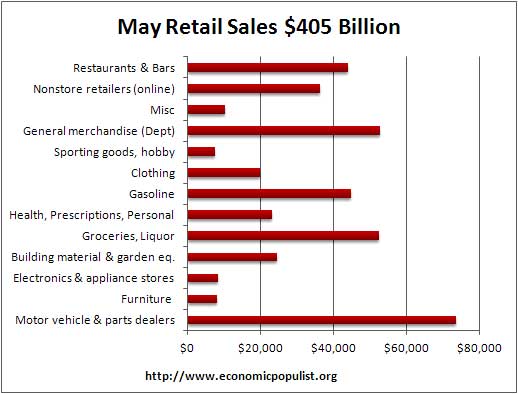
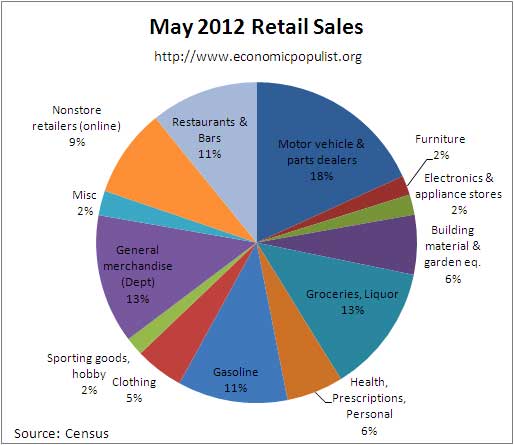
As we can see retail sales this month can be blamed on declining gas sales due to dropping prices, although building material, garden equipment & supplies dealers had a pretty bad month, down -1.7%. Below are the May retail sales categories by volume. As we can see, autos & auto parts are king when it comes to retail sales.
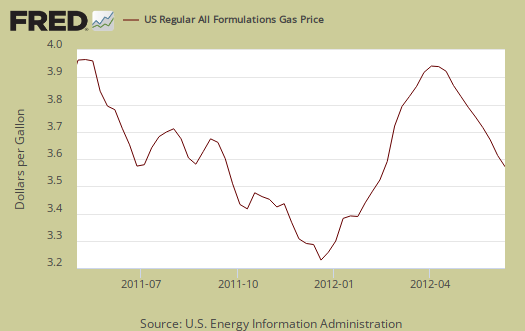
For reference sake, graphed below are weekly regular gasoline prices, so one can see what happened in May.
The below chart breaks down seasonally adjusted retail sales by category as a percentage of total May sales by volume. It's just shocking to see how cars make up of monthly retail sales volumes, in comparison to every day items.
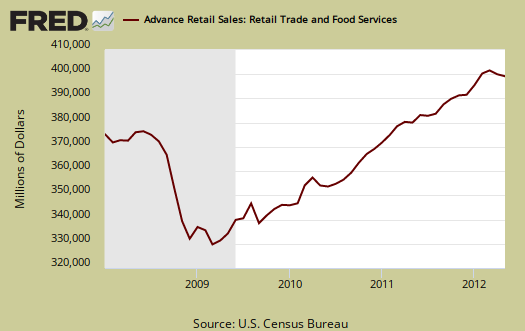
Retail sales correlates to personal consumption, which is about 70% of GDP growth. Yet GDP has inflation removed from it's numbers. This is why Wall Street jumps on these retail sales figures. Below is the graph of retail sales in real dollars, or adjusted for inflation, so one gets a sense of volume versus price increases. To obtain real values, retail sales are deflated using CPI, where the May figures come out on Friday. Below is the annualized monthly percentage change in real retail sales.

Retail sales are not adjusted for price increases, not reported in real dollars. Real economic growth adjusts for inflation. Retail sales has variance, margins of error, and is often revised as more raw data comes into the U.S. Department of Commerce (Census division). For example, this report has an error margin of ±0.5%. Data is reported via surveys, and is net revenues of retail stores, outlets. Online retail net revenues are asked in a separate survey of large retail companies (big box marts). This is also the advanced report. To keep the monthly nominal percentage changes in perspective, below is the graph of monthly percentage changes since 2008.
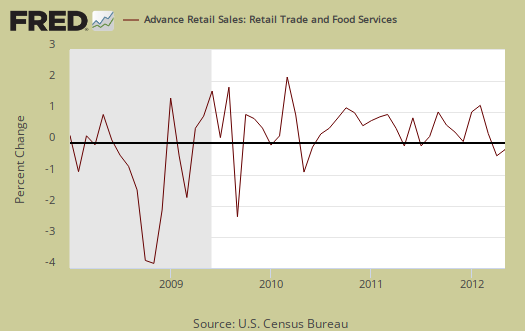
Seasonal adjustments are aggregate and based on events like holidays associated with shopping, i.e. the Christmas rush.
Advance reports almost always are revised the next month as more raw sales data is collected by the Census.
Here is last month's overview, unrevised.
Recent comments