
November 2011 Retail Sales increased 0.2%. October retail sales were revised up a 10th of a percentage point to 0.6%. Retail sales are up 6.7% from the same time last year. Electronics and Appliance stores shot up another 2.1% in a month, and were 20% of the total increase in retail sales. Autos still rule the retail world and sales by dealers was over half the increase by dollars of retail sales for November, a 0.7% increase from October.
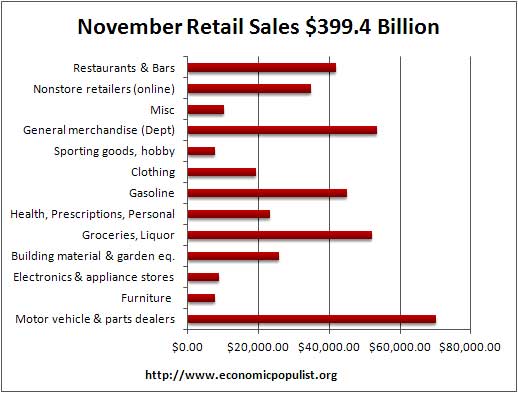
Total retail sales are $399.4 billion for November. While electronics and appliances increased 2.1% from last month, it's not the real driver of consumer spending.
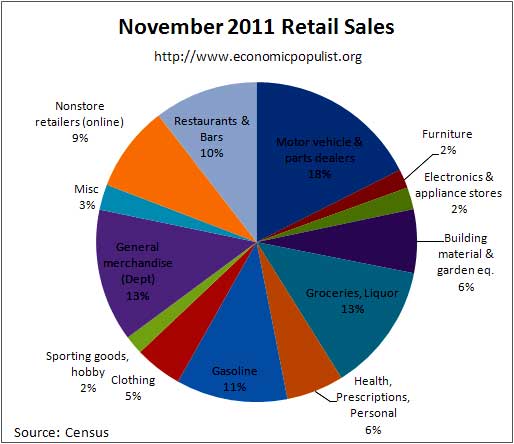
The above chart breaks down seasonally adjusted retail sales by percentage of total November sales. As we can see, electronics is only 2.2%. Computer and software store sales (which includes smartphones), are only 22% of the total store sales for the electronics & appliances category. There is a lot of hype surrounding smart phones, but sorry, smart phones do not save the economy. Below is a bar chart breaking down net sales revenues reported by surveyed stores (retail outlets).
Motor Vehicles & Parts are the big money of retail sales. We spend more money on our cars than groceries and booze. Motor vehicle sales were up +0.7% in November and are up 8.1% from November 2010. Auto sales are $63.4 billion, or 15.9% of all retail sales. Motor Vehicles and Parts, or everything car retail sales increased 0.5% for November and are up 7.5% for the year.
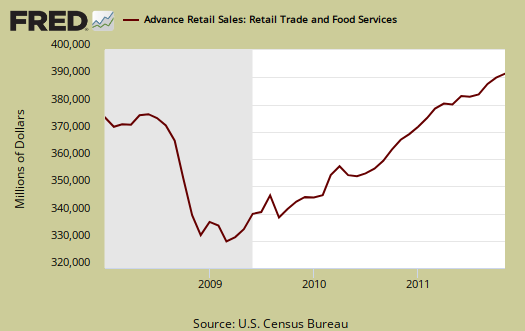
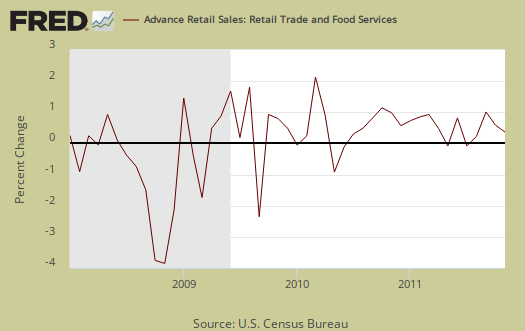
Retail sales are not adjusted for price increases, not reported in real dollars. Real Economic growth adjusts for inflation. Retail sales has variance, margins of error, and is often revised as more raw data comes into the U.S. Department of Commerce (Census division). Data is reported via surveys, and is net revenues of retail stores, outlets. Online retail net revenues are asked in a separate survey of large retail companies (big box marts). This is also the advanced report. To keep the gains in perspective, below is the graph of monthly percentage changes since 2008.
Gas sales decreased -0.1% from October but are still up a whopping +12.9% for the year. People spending more to fill up their tank is not much of a job creator in the U.S. and sales are much more correlated to changing gas prices. Grocery retail sales decreased -0.3% and are up +4.6% from November 2010.
Nonstore retailers increased +1.5% but are up +13.9% from the year previous. Nonstore retailers are online shopping, mail order, door to door. Online shoppin' is roughly 76% of nonstore retail sales. It's clear e-shopping is increasing in market share and is becoming a large factor in overall retail sales.
Retail trade sales are retail sales minus food and beverage services and it increased +0.3% in November and are up +6.8% for the year. Retail trade sales includes gas.
Building material, garden equipment decreased -0.3% this month and is up 6.2% for the year. Sporting goods, books, music, hobby retail sales increase 0.3% and are up 6.3% for the year. Furniture increased +0.4% and is up 4.4% for the year. Department stores increased +0.3% and are down -3.0% from this time last year.
Advanced retail sales are reported three month tallies. There is variation in the monthly reported figures as well as data reporting lag. The three month tally, from September to November, is up +2.1% from the previous three month period and +7.4% in comparison to the same period in 2010.
Seasonal adjustments are aggregate and based on events like holidays associated with shopping, i.e. the Christmas rush.
Retail sales correlates to personal consumption, which is about 70% of GDP growth. Yet GDP has inflation removed from it's numbers. This is why Wall Street jumps on these retail sales figures. Lord help them if America stops shoppin'. 2010 saw poverty rates as high as 1993 and wages were flat. Increases in real disposable personal income are usually low or declining. In other words, where people are getting the cash to go shoppin' is anyone's guess.
The below graph is retail sales minus autos & parts. Retail sales minus autos & parts increased +0.6% for October and is up +7.3% since this time last year.

Retail minus auto & parts, food and beverages is up 0.2% for November and 6.6% for the year. Here is last month's overview unrevised. Advance reports almost always are revised the next month.
While Wall Street cheers and this report is useful for individual retail sectors, for better macro economic indicators the personal income & outlays report gives monthly real, or adjusted for inflation, personal consumption expenditures. Basically if prices increase, so do retail sales, even if the volume remains the same.
auto sales slight of hand?
I've read that auto sales numbers represent cars sent to dealers not actual cash sales to customers and dealer inventories are very high. if so then the auto sales statistics are misrepresent actual sales.
Anyone know if this is true?
Tom
as i understand the survey
You know, you can literally call up our friendly neighborhood government statisticians if all else fails, which is pretty dog gone cool. Can't say that much about most of our tax dollars.
From the actual survey are the instructions to Automotive Dealers on what to report:
• In e-commerce the sales of cars where a binding sales
price is established online through the dealer’s or a third
party’s web site
• Charges for dealer preparation, warranty charges,
and delivery costs
• Combined sales for all new and used car locations
and service facilities within the immediate vicinity of the
new car showroom when such locations are considered
integral parts of the "new car" business and separate
books are not maintained for their operations
• EXCLUDE receipts from customers for tag and title fees,
licenses, etc., forwarded to State or local licensing agencies.
So, I'd take that they should not be counting as sales only cars delivered but not actually sold, but ya know, maybe they are cheating or I'm missing something from their survey instructions.
I put the link to the "magic special place" of the government statistic agency web space on all of these overviews, first link for the current release to more data and FAQs. Not that most read all of those details or even these overviews or get past some buzz headline from Bloomberg which claims "retail sales below analysts' estimates" or whatever. ;)
I'm tell ya where I think things are extremely funky is the import/export price deflators.
Inventories were released, some and I didn't get to overviewing recent, but we can take a look see on retail inventories for autos, dealers, potentially too.
Mish and auto sales
Thank you for that prompt and detailed response. It got me to thinking where I read about auto sales and i came up with Mish 11/9/11 where he writes:
"Sales down and dealer inventory up 15% at GM.
"The key takeaway from last months "good" GM sales report is it was largely based on channel stuffing. "Sales" get reported when cars are shipped to the dealer and cars are stacking up at GM dealers."
Mish is always a mixed bag. At times he has excellent statistics and others, like the auto sale comment, no elaboration.
Tom
more auto sales - GM
get an account so you don't have to go through the moderation queue and can use links and such.
Well, it sounds like Mish is quoting wholesale, i.e. GM is the supplier. This report is retail and since GM doesn't sell directly to the consumer, unless they own the dealerships directly, but I believe those dealerships are franchises, 3rd party, then their corporate quarterlies I think go to wholesale. Also, GM is #2 (?) globally, 3 U.S.? i.e. not the entire auto industry.
Downward trends in auto sales through are one of those thumb in the airs indicators not all is well in consumer land. That's about the only time they pay attention to the average American...when we stop shoppin'.
Black Friday & Cyber Monday Retail Sales Hype Machine
a few things on the hype coming out of Black Friday, Cyber Monday, if any recalls the MSM headlines and news casts blasted and blazed on and on about record sales.
First, this report is aggregate and includes food, restaurants, bars, groceries, gas. Then, this report is seasonally adjusted as noted.
Then, revisions are bound to appear. Finally, the report is in raw dollars, not volume. If retailers sold at steep discounts, sales volume won't translate into sales.
We'll see, but I think the media reports on black friday are hype machine, and why I didn't write up anything about it. I also find it all sick to have a 2 month long consumer fest and call that a holiday. People are broke, broke, broke here and the very best gift anyone can give is hiring people. Give people a job for Christmas, or buy a made in America product to directly give someone one.