Obama's Fingerprints All Over Investigations Of Trump And Clinton
Authored by Paul Sperry via American Greatness,
In the run-up to the 2016 Democratic Party convention, FBI Director James Comey gained access to at least eight thumb drives containing large volumes of former Secretary Hillary Clinton’s sensitive State Department emails—as well as some from President Obama—that appeared to have been compromised by foreign hackers.
Instead of investigating the explosive new batch of evidence revealed in recently declassified documents, Comey rushed ahead to close an investigation into whether Clinton improperly transmitted and received classified material from a private, unsecured server she kept in her basement. Comey also took the extraordinary step of bypassing the attorney general and personally exonerating Clinton of wrongdoing during an unusual press conference on July 5, 2016.
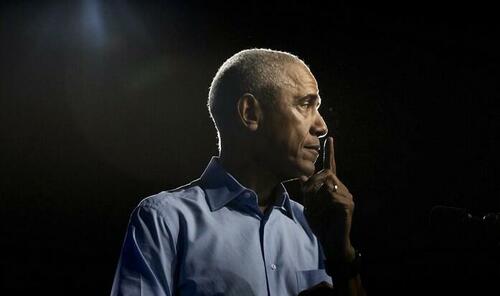
Just hours later, Obama invited Clinton—who would be formally nominated as the Democrats’ standard bearer three weeks later—aboard Air Force One to help launch her multicity campaign tour, during which he officially endorsed Clinton as his preferred White House successor. “I’m ready to pass the baton,” Obama declared, as he stumped for her for the first time.
Comey’s decision to remove the cloud of scandal over Clinton’s campaign, allowing the president to get on with the business of campaigning for her, is just one avenue of investigation the Justice Department is pursuing in wide-ranging probes whose targets include a figure largely unscathed by his era’s scandals: former President Barack Obama.
Attorney General Pam Bondi said prosecutors are investigating, among other things, “possible coordination between the Clinton campaign and the Obama administration to interfere with the 2016 presidential election.”
Jason Reding Quiñones, the U.S. Attorney for the Southern District of Florida, has impaneled a grand jury to hear evidence related to an alleged “grand criminal conspiracy” by Obama and Biden officials to enlist law enforcement and intelligence agencies in rigging elections and carrying out political espionage against Donald Trump.
The fate of these investigations is still unclear. Actions against former presidents—especially for conduct in office—have been exceedingly rare, with the exception of President Trump. And the courts have pushed back on the Trump administration’s recent efforts to indict other Obama-era figures, including Comey.
Nevertheless, a RealClearInvestigations look at the evidence Trump administration prosecutors are presenting to the grand jury, which includes a raft of recently declassified CIA and FBI documents, shows Obama’s deep involvement in both protecting Clinton and advancing the conspiracy theory that Trump conspired with Russian President Vladimir Putin. Drawing from thousands of pages of documents and exclusive interviews with law enforcement and intelligence officials, RCI’s analysis shows the former president was repeatedly at the center of events surrounding both the closing of the Clinton investigation and the subsequent opening of several investigations targeting the Trump campaign. Post-election, Obama also ordered the manufacturing of anti-Trump intelligence, which set Trump’s presidency up for continued investigations.
On the Tarmac
Airports played an outsized role in the 2016 election. It was former President Bill Clinton’s June 27 meeting with Attorney General Loretta Lynch on his parked plane at a Phoenix airport that reportedly convinced Comey that Lynch might appear compromised and that he should go around the proper charging officer for federal crimes to clear his wife.
About a week later, Obama signaled the all-clear after Comey’s press conference by inviting Hillary Clinton to fly to campaign rallies on Air Force One.
“I’m here today because I believe in Hillary Clinton,” Obama said during their July 5, 2016, rally in Charlotte, N.C. “I have had a front-row seat to her judgment and her commitment.”
Some presidential security experts and Secret Service sources contacted by RCI said the timing of the trip was suspicious.
They point out that the president authorizing Clinton to fly aboard Air Force One on the same day his hand-picked FBI director absolved her of crimes was almost certainly not a last-minute decision because it would have required extensive pre-planning.
“The security involved in setting up that tour took weeks of advance work, which means Obama knew she was going to be cleared and not charged,” said a veteran Secret Service official who spoke on the condition of anonymity to discuss a sensitive matter. “Obama wasn’t going to risk endorsing her and joining her on the campaign trail without her first being cleared of federal crimes,” he added. “He knew about the end of the investigation well ahead of time.”
Although the FBI did not interview Clinton about her emails until July 2, 2016, Comey had been circulating drafts of his exoneration statement at FBI headquarters for months and conveying to agents there was an “extraordinary sense of urgency” to complete the investigation, according to the declassified documents released recently by the Justice Department. Critics note that the reasoning he offered for clearing Clinton in his July 5 statement was rife with contradictions. “Although there is evidence of potential violations of the statutes regarding the handling of classified information,” Comey said, “our judgment is that no reasonable prosecutor would bring such a case.”
It is not known if any of the drafts were shared with the White House. Secret Service entry logs show Comey visited with Obama at least three times in 2016. “The timing and presumption that Clinton would eventually be the Democratic Party nominee for President was part of the defendant’s decision-making process,” according to court papers the DOJ filed in November detailing why it alleges Comey predetermined Clinton’s innocence.
Pulling Punches
The new evidence suggests that Comey wasn’t acting alone. It indicates that Obama was more involved in the Clinton probe than previously reported and that Comey, whose entire family supported Clinton, may have pulled his punches to placate the incumbent president and avoid getting on the wrong side of the woman he assumed would be Obama’s successor.
The recently declassified appendix of a 2018 report from the DOJ’s inspector general reviewing the integrity of the FBI’s investigation of Clinton found that the FBI never searched the eight thumb drives containing thousands of unexamined Clinton emails that were “exfiltrated” by foreign actors. Comey was first briefed about the cache of new evidence in May 2016 when he had begun drafting his exoneration statement, and then again a week before he unilaterally exonerated Clinton.
FBI lawyers admitted in internal written memos, also recently declassified, that the information was necessary to conduct a “thorough and complete investigation” and “assess the national security risks” associated with the breaches from Clinton’s use of a private email server, which cyber-forensic analysts had already found contained at least 2,063 classified emails, some at the “Top Secret/Special Access Program” level. They also thought it was necessary to divine “the full scope of unauthorized disclosure of classified emails found on the former Secretary’s server and to identify any potential cyber intrusions of the server.”
“They got some thumb drives that dealt with all these issues, [and] they didn’t even bother to go through [them],” said Senate Judiciary Committee Chairman Charles Grassley. “It was a complete cover-up.”
The appendix also reveals Democratic National Committee communications suggesting that Obama’s attorney general, Lynch, was secretly in communication with the Clinton campaign during the probe of her emails and had assured campaign officials that the FBI would go easy on her.
According to the communications, which U.S. intelligence analysts determined were “not fabrications,” Obama was putting “pressure” on Comey through Lynch to get rid of Clinton’s email scandal as early as January 2016. Not long after, Comey began drafting his statement exonerating Clinton—months before FBI agents had ended their investigation.
In her 2018 congressional deposition, Lynch testified that she never obstructed the probe or exerted any influence over it. But she has acknowledged that she had spoken to Comey about diminishing the probe’s significance by referring to the email investigation in the press as a “matter,” not an investigation. Lynch did not respond to requests for comment sent to her law firm.
DNC communications from March 2016 revealed that Obama also “sanctioned the use of administrative levers” to scuttle the FBI’s investigation of the Clinton Foundation. Recently declassified FBI documents show that around the same time, FBI Deputy Director Andrew McCabe had ordered field agents to back off their investigation of Clinton Foundation donors and former Secretary of State Clinton as part of a possible pay-for-play scheme. McCabe did not respond to requests for comment sent to his attorney and to George Mason University, where he is a visiting professor.
(Just months earlier, McCabe and his wife Jill met with Virginia’s then-Gov. Terry McAuliffe, a longtime Clinton ally, was at the governor’s mansion in Richmond to discuss raising money for Mrs. McCabe’s state senate race. The Clinton machine ended up pumping more than $675,000 into Jill McCabe’s Democratic campaign. McAuliffe had long maintained a seat on the Clinton Foundation board. RCI has learned, furthermore, that before moving to the D.C. area, the McCabes were 15-year neighbors of the Clintons in the hamlet of Chappaqua, N.Y., according to property records.)
Then, on July 20, just five days before the start of the Democratic National Convention, FBI headquarters shut down the Clinton Foundation investigation. “Based on the [political] sensitivities surrounding the Clinton Foundation,” a just-declassified internal FBI document reveals, agents were suddenly barred from issuing subpoenas, conducting interviews, or sharing bank information related to the case with other offices. HQ warned field offices to avoid creating “any impression we are investigating the Clinton Foundation or the Clintons.”
RCI made several requests for comment to Comey and Obama. Comey declined comment through his attorney, Patrick Fitzgerald, who successfully defended him against federal perjury and obstruction charges. The DOJ is appealing the case, which was dismissed by a Clinton-appointed judge, not on the merits, but on the grounds that the federal prosecutor who indicted him had not been appointed properly. Obama’s Washington office declined comment.
At the time, the White House insisted it had no prior knowledge of Comey’s decisions.
Trump, who was on the verge of accepting the Republican Party’s presidential nomination, did not buy it. He accused Obama and Comey of running a “rigged” investigation of his Democratic opponent.
“It was no accident that charges were not recommended against Hillary the exact same day as President Obama campaigns with her for the first time,” Trump said on July 5, 2016.
Unbeknownst to Trump, July 5 would loom large for another reason: On the very day Obama’s FBI cleared Clinton, it set its sights on him.
Using the FBI To Smear Trump
That day, the bureau received the first in a series of false reports alleging Trump conspired with Russia. The reports, authored by former British intelligence officer Christopher Steele, then working as an FBI informant, were funded by Clinton’s campaign.
Weeks later, President Obama was personally warned by the CIA that the Clinton campaign was planning to create a foreign espionage scandal falsely tying Trump to Russia to distract attention from her own espionage investigation involving her use of a private server to transmit classified emails.
A declassified memo revealed that Clinton had personally approved a plan to “smear” and “demonize” Trump as a Putin stooge, which was proposed by one of her foreign policy advisers, Julianne Smith, who had previously served as Vice President Joe Biden’s deputy security adviser. Clinton’s campaign manager, Robbie Mook, later testified in Special Counsel John Durham’s investigation that Clinton personally approved a plan to claim Trump had a back-channel to Putin through a Russian bank—an assertion that proved utterly baseless. “We discussed it with Hillary,” Mook told a D.C. court in 2022. “She agreed with the decision.”
According to the document, Smith said that the FBI, where Clinton had “supporters,” would help pour fuel on “the fire,” suggesting foreknowledge of the coming Russiagate investigation, which had not yet been formally opened. She added that they would also get help from the “IC,” or intelligence community, where Clinton had a lot of “sympathizers.”
Strikingly, there appeared to be an understanding among Clinton campaign aides that the FBI and CIA would get involved in an effort to kneecap Trump well before such an effort manifested in an official capacity.
In addition, the campaign solicited help directly from the White House.
In a July 25 text-message exchange with another Clinton adviser, Smith reached out to a special assistant to the president and National Security Council member for information about an “investigation” into Russia and Trump. “She went as far as she could” in divulging sensitive information, Smith told the other adviser. Sources say the Obama aide is believed to be Celeste Wallander, who at the time was also senior director for Russia and Eurasia on the National Security Council. Smith indicated she also contacted the “OVP,” or office of the vice president.
Smith told Durham she did not “specifically remember any such idea” to spread dirt on Trump. Wallander did not reply to requests for comment when contacted at her new position as executive director of the University of Pennsylvania’s office in Washington.
Grassley said that the new evidence, which he has fought for years to declassify, provides additional proof that “the Clinton campaign believed elements of the Obama administration would help them achieve their political ends against Trump.”
The plan to tie Trump to Russia went prime time during the DNC convention, held from July 25 to July 28.
During his nationally televised convention speech on July 27, Biden warned, “We cannot elect a man who belittles our closest allies, while embracing dictators like Vladimir Putin.” Obama pitched in during his own speech the following night, claiming that Trump “cozies up to Putin.”
Comey also knew about Clinton’s plan to manufacture a smear campaign against Trump, according to Durham. Yet on July 31, 2016, he approved the opening of the code-named “Crossfire Hurricane” espionage investigation of the Trump campaign for alleged—and since-disproven—collusion with Russia. Three months later, Comey even obtained a wiretap to spy on one of Trump’s campaign advisers, Carter Page, based almost entirely on the false allegations in the Clinton-funded Steele dossier.
The Russia probe was headed by Peter Strzok, the same FBI counterintelligence official who led the Clinton email probe. Internal FBI communications strongly suggest Strzok plotted to take a hard line against Trump.
On July 31, Strzok texted FBI lawyer Lisa Page, who worked directly under Comey’s deputy, Andrew McCabe, to discuss the difference in the two investigations. He emphasized that the Trump case mattered more than the Clinton case, and suggested that the FBI merely checked the boxes in its investigation of Clinton.
“[D]amn this feels momentous. Because this matters. The other one did, too, but that was to ensure we didn’t F something up. This matters because this MATTERS,” Strzok said. “So super glad to be on this voyage with you.”
“White House Is Running This”
Strzok would soon learn he was the nominal head of the investigation. On. Aug. 3, Obama met with Biden, Comey, and several other officials inside the White House to discuss the Clinton plan to link Trump and Putin, according to declassified records.
The next day, Strzok attended a meeting with CIA officials as part of an interagency group on Russia and Trump created by then-CIA Director John Brennan. Known as the “fusion cell,” the group was quarterbacked by CIA official Elizabeth “Liz” Vogt.
The following day, Strzok texted his FBI partner Page about the meeting. “Went well, best we could have expected,” he said, though he seemed annoyed to hear his investigation was under the control of the president. “Other than Liz’s quote, ‘the White House is running this,’” he added.
Nonetheless, their goals were aligned: Help Hillary Clinton, hurt Donald Trump.
Strzok and Page had earlier agreed to aggressively probe Trump to “stop” him from being president, in contrast to the softball approach they endeavored to take investigating Clinton. “One more thing: [Clinton] may be our next president,” Page wrote Strzok. “The last thing you need [is] going in there loaded for bear.”
“Agreed,” Strzok replied, before interviewing Clinton.
Both Strzok and Page have been subpoenaed by the recently impaneled federal grand jury hearing conspiracy evidence.
Instead of alerting the Trump campaign about the bureau’s concerns, Strzok dusted off the rarely used law, the Foreign Agents Registration Act, to open additional espionage cases targeting Trump campaign officials Paul Manafort (code-named “Crossfire Fury”), George Papadopoulos (“Crossfire Typhoon”), and Carter Page (“Crossfire Dragon”).
The following week, he used FARA to open another counterintelligence case on Trump national security adviser, Michael Flynn, under the code name “Crossfire Razor.”
In a Sept. 2, 2016, text exchange, Page wrote Strzok that she was preparing talking points for Comey to brief Obama on their progress because “Potus [President of the United States] wants to know everything we’re doing.”
Also, Obama appeared to be directing political strategy for the Democratic ticket from the White House.
In October 2016, Clinton’s running mate Tim Kaine was caught on video saying Obama had called him the prior night to warn him Trump was in bed with “fascist” Putin. In a conversation captured in the 2020 documentary “Hillary,” Kaine said the president demanded he and Clinton go hard on Trump: “Tim, remember, this is no time to be a purist. You’ve got to keep a fascist out of the White House.” Clinton is overheard saying, “I echo that sentiment,” and hints at a nefarious relationship between Trump and Russia.
A little more than a week before the election, Comey reluctantly reopened Clinton’s email case—a controversial decision he made only after New York FBI agent John Robertson blew the whistle on headquarters trying to “bury” the discovery a month earlier of more than 300,000 new Clinton State Department emails he found on a laptop Clinton confidante Huma Abedin shared with her then-husband, Anthony Weiner, a former Democratic lawmaker from New York, as RCI first reported.
“The only reason Comey reopened the investigation is that the New York office threatened to bypass FBI headquarters and go straight to the Department of Justice regarding the additional emails that were discovered as a result of the Weiner [sex crimes] investigations,” former prosecutor and assistant FBI Director Chris Swecker said in an RCI interview.
Around the same time, McCabe denied field agents potentially valuable evidence from the Weiner laptop that could have justified reopening their Clinton Foundation probes, recently declassified FBI records also reveal.
Obama Doubles Down
After Trump defeated Clinton the following month, Obama doubled down, ordering U.S. intelligence agencies to revisit their prior assessments that found no evidence the Russian government tried to hack the election for Trump.
Within just three weeks of Obama’s Dec. 9 order, the CIA came up with new evidence to conclude Putin personally launched an influence operation to help swing the race to Trump. The publicly released version of the assessment, which helped Obama and Clinton explain her shocking defeat, hid the fact that the CIA relied in part on the Clinton-funded dossier to reach its new conclusion.
Intelligence contradicting the “key judgment” that Putin helped Trump win was omitted from the assessment, known as the ICA. Career analysts objected to using the dossier, but Obama’s CIA chief Brennan overruled them. At least one senior intelligence analyst, now a whistleblower cooperating with the DOJ in its ongoing investigation of the entire scandal, said he was “threatened” by superiors to change his pre-election assessment to suggest Putin stole the election for Trump.
The Obama White House even prevented analysts preparing the new assessment from seeing the incriminating so-called Clinton Plan intelligence that exposed the plot to frame Trump as a Russian conspirator. In denying ICA drafters access to the intel, the White House spuriously claimed it was withholding the material “on grounds of executive privilege,” according to a secret congressional report that debunked the intelligence behind the ICA. (The explosive 2018 report had been locked in a safe at CIA headquarters until its declassification and release in July.)
On Dec. 15, 2016, weeks before the assessment had been finalized, Obama let it slip out in an NPR “exit interview” at the White House that his intelligence team had essentially predetermined the conclusion of the Trump-Russia assessment.
He said that no one should be “surprised by the CIA assessment that this [Russian meddling in the election] was done purposely to improve Trump’s chances [of winning].” Obama even suggested that Putin “was helping the Trump campaign.”
“So what the CIA is now assessing—which was, it was done purposefully to tilt the election in the direction of a particular candidate—shouldn’t be a surprise to anybody,” Obama added.
Standing in the wings, Susan Rice, the president’s national security adviser, sent Obama back into the room following the interview to reassert that the assessment was still under review.
“You had something to add?” asked NPR’s Steve Inskeep.
“It is worth noting that when it comes to the motivations of the Russians, there are still a whole range of assessments taking place among the agencies,” a clearly chagrined Obama said, his voice cracking. “And so when I receive a final report, you know, we’ll be able to, I think, give us a comprehensive and best guess as to those motivations.”
He stressed that “different agencies are still looking at all that stuff, gathering it together and hopefully putting [it] into a single package.” In fact, only three of the 17 intelligence agencies were involved in the process—the CIA, FBI, and NSA—and only five analysts drafted the final intel report, all of whom were handpicked by Obama’s CIA Director Brennan, who previously worked for Obama in the White House.
Obama’s intelligence czar, James Clapper, later revealed in a 2018 interview that the Obama-ordered assessment set off a chain of investigations targeting Trump and his administration over Russia.
“If it weren’t for President Obama, we might not have done the intelligence community assessment that we did that set up a whole sequence of events which are still unfolding today, notably, Special Counsel [Robert] Mueller’s investigation,” Clapper told CNN. “President Obama is responsible for that.”
Recently declassified emails reveal that after taking his marching orders from Obama, Clapper pressured the NSA, which had partially dissented from the key judgment that Putin personally intervened in the election to help Trump, to get “on the same page” and be “supportive” of the conclusion. He suggested they would all have to “compromise” their normal standards for intelligence-gathering to rush out the report to meet Obama’s deadline.
Sen. Grassley was even more emphatic: “There’s no doubt the new intelligence assessment was a political hit that had been ordered by President Obama.”
Both Clapper and Brennan have been told by federal prosecutors they are “targets” of investigation and have been subpoenaed by the grand jury looking at conspiracy charges. In a letter from his attorney, Brennan said he has cooperated with the probe, turning over documents requested for the period July 2016 to February 2017. Brennan said he stands by the ICA and complained he is the target of a “manufactured criminal investigation.” Attempts to reach Clapper for comment were unsuccessful.
Oval Office Planning Session
The first week in January 2017 was a busy time at the Obama White House.
On Jan. 5, Obama and Biden held an Oval Office meeting with Comey and other officials during which they discussed using the Logan Act, a little-used 18th-century law that criminalizes efforts by private citizens to conduct American foreign policy, against Trump’s incoming national security adviser, Michael Flynn. Later that month, Comey dispatched Strzok to the West Wing to ambush Flynn in an interview that would set a perjury trap leading to Flynn’s ouster and indictment on charges that were later dropped.
More significantly, they also discussed a plan to confront President-elect Trump with false allegations from the Steele dossier, which Comey presented as “intelligence.” On Jan. 6, Comey briefed Trump on Russia-related allegations, including those in the now-debunked Steele dossier—the same day the administration released an unclassified version of the ICA to the public.
Comey’s private briefing with Trump was later leaked to the press, lending credence to the dossier and giving Washington journalists official cover to publicize its transparently bogus rumors, starting with Buzzfeed, which published the entire Steele Dossier on Jan. 10.
On Jan. 12, still under the direction of the Obama administration, Comey also sought the renewal of a wiretap warrant to continue spying on Trump adviser Carter Page as a suspected “Russian agent”—the same day the bureau received an intelligence report warning of false information in the dossier that had put Page under suspicion. And Comey knew by that point the dossier was based on fabrications by Steele’s paid “primary subsource.”
Later that month, Comey’s investigators learned while interviewing Igor Danchenko, a former Brookings Institution analyst who worked as Steele’s primary researcher, that key allegations in the dossier were nothing more than “bar talk.” Comey nonetheless approved the affidavit—underpinned by those same dossier lies—to electronically eavesdrop on Page for another 90 days.
“With all these red lights flashing STOP, the Obama administration went full speed ahead,” Grassley said.
Some former prosecutors see a conspiracy in the unequal investigative treatment of Clinton and Trump, and they place Obama at the center of it.
“There are reasonable grounds for an investigation to determine if this was part of a broader conspiracy to protect Hillary Clinton and influence the election by smearing Trump at the same time,” said Swecker, a former prosecutor and top FBI official.
“I don’t think there’s any doubt Obama was the mastermind behind the whole conspiracy,” he told RCI. “The problem is proving it.”
Trump leveled similar allegations last year, even going so far as to accuse the 44th president of “treason.” Obama spokesman Patrick Rodenbush dismissed the accusations as “bizarre” and “ridiculous.”
Hannah Hankins, now acting spokesperson for Obama’s post-presidency office, told RCI, “I won’t have anything new to add for this story.”
Tyler Durden
Fri, 01/23/2026 - 21:45


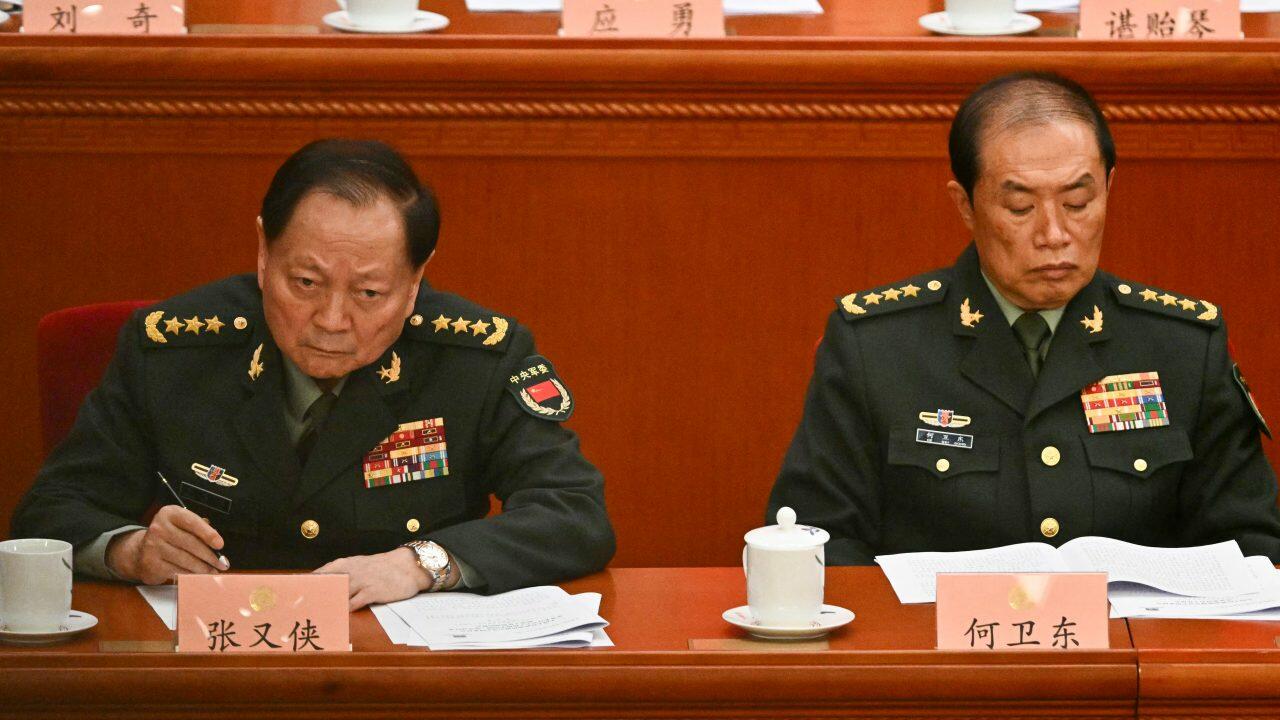 AFP: Zhang Youxia, left, and He Weidong, the previous second ranked Vice Chairman who was purged in 2025.
 via X/@whyyoutouzhele
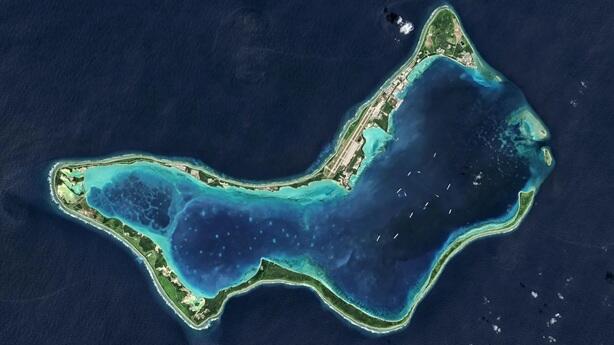 Getty Images/BBC: Diego Garcia has been home to a joint UK-US military base since the 1970s
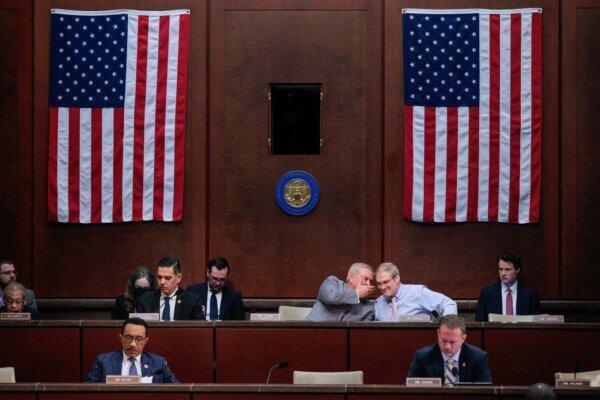
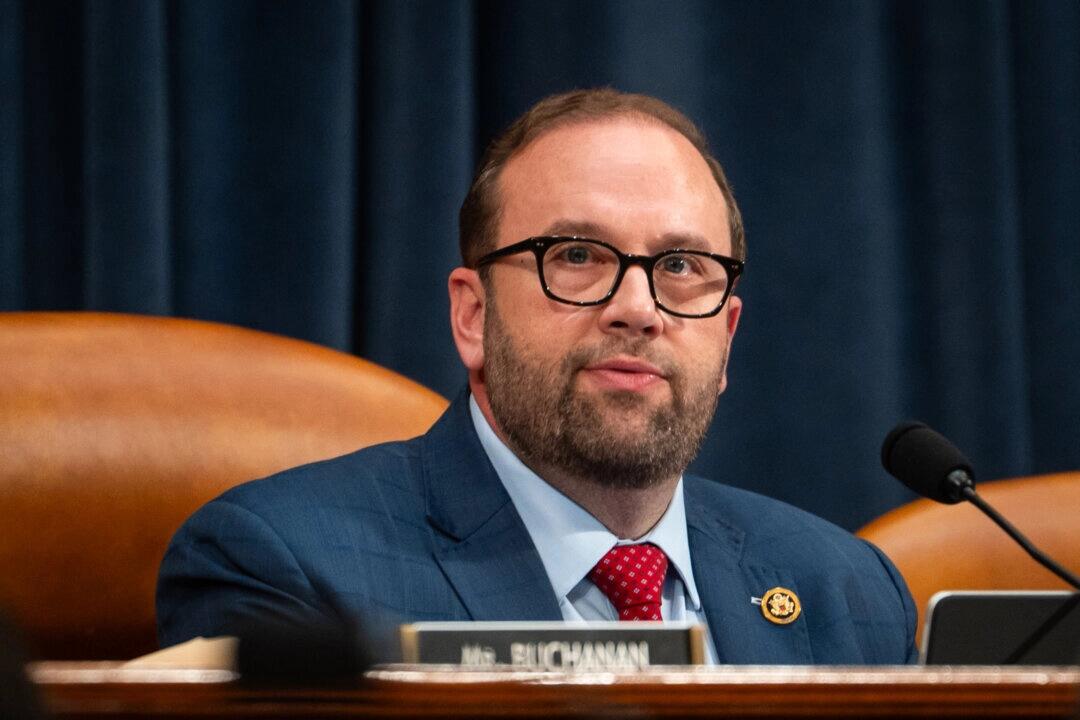 House Committee on Ways and Means Chairman Rep. Jason Smith (R-Mo.) speaks during a hearing on Capitol Hill in Washington on May 13, 2025. Madalina Vasiliu/The Epoch Times
 via AFP


 via BBC


Recent comments