
Previously in Part I of this series, I explained the need to re-examine economic indicators to determine how they performed in previous periods of deflation. In Part II, I looked at the year-over-year M1 vs. CPI indicator during the Roaring Twenties. That examination showed that, in the 1920s, the M1 vs. CPI indicator generally worked well, with two differences from the Inflationary Era: (1) if anything, the indicator slightly lagged signaling the start of recessions, and led signaling expansions; and (2) when M1 was not growing -- when it was stagnant or declining -- it did not signal expansion even though its YoY change was less negative than a CPI deflation.
III. Great Depression, post WW 2 deflation -- monetary indicators
In this installment I will look at the same M1 vs. CPI indicator during the Great Contraction and New Deal portions of the Great Depression, and the brief post World War 2 deflation of 1948-49 (the last significant period of deflation before now).
Before we examine the Great 1929-1932 Contraction, let's look at the Recesion of 1937-38 (as previously, YoY M1 is in blue, CPI is in red):
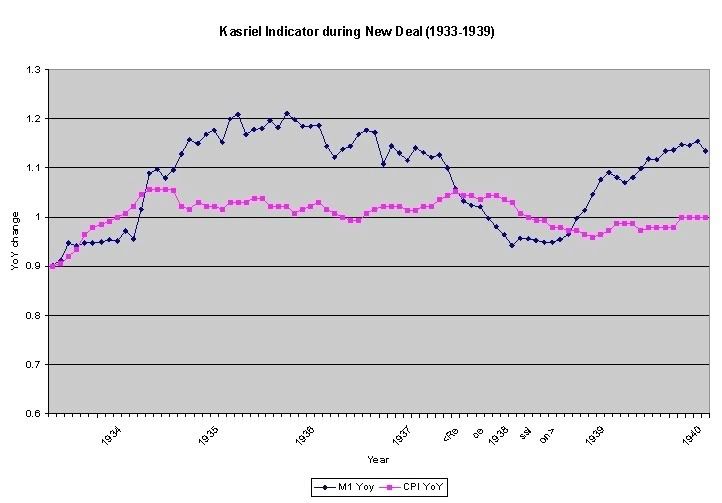
As with the Roaring Twenties, our monetary indicator works flawlessly here, with M1 declining below CPI in June 1937, only one month after the onset of the recession in May 1937, and exceeding CPI in August 1938, two months after its end in June 1938.
Now let's look at the post World War 2 deflation (note the scale is smaller on this graph to better show differences):
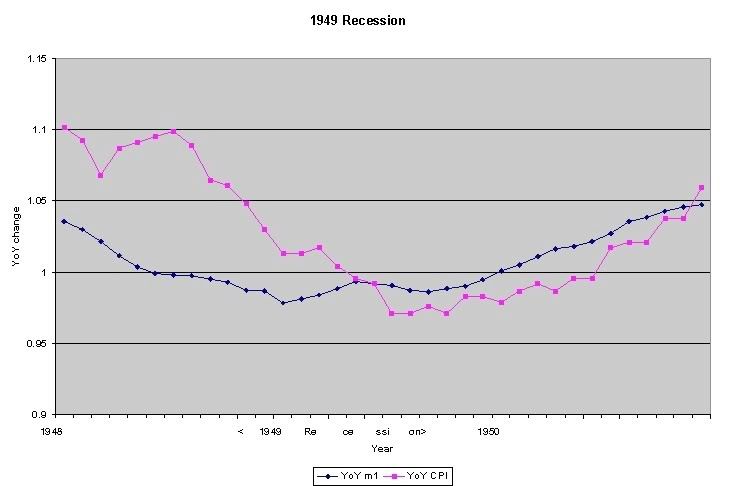
This graph looks very similar to the post World War 1 deflation of 1920-21: M1 is robustly positive before the recession (November 1948), although far less than CPI inflation. YoY M1 exceeds CPI in July 1949, three months before the end of the recession in October 1949, signaling a new expansion.
Now let's turn our attention to the Great Contraction:
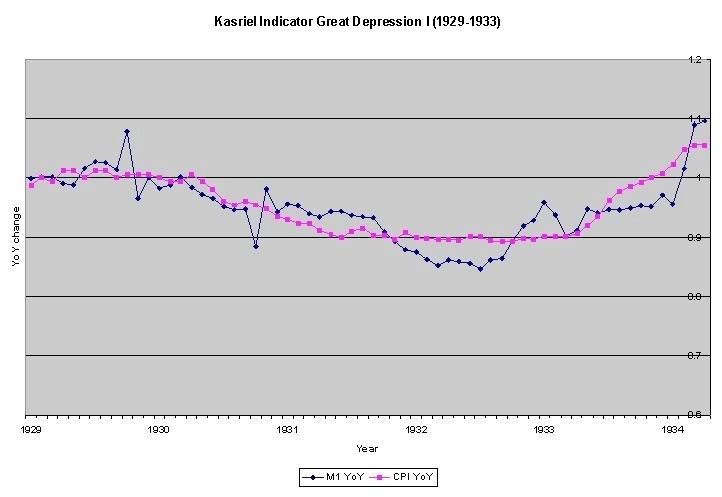
In this, the biggest of all economic contractions of the last century, the monetary component of the Kasriel indicator completely breaks down. There is a brief spurt of M1 in late 1929 at the time of the stock market crash. M1 again exceeds CPI all during 1931; and even worse, M1 lags CPI thoughout the crucial last 9 months of 1933 when economic expansion had again begun.
And yet, in the Great Contraction, like all of our other deflationary recessions, there is a clear pattern of M1 and CPI on the graphs --both turn down, then sometimes sideways, before simultaneously or with M1 leading the way before CPI, both turn back up near the end of the deflationary recession.
I will comment further with a more formal framework in the concluding post of this series. But first, now that we have examined monetary indicators, I will look at interest rates and the yield curve from the Roaring Twenties through the post WW 2 deflation, in my next installment. It develops that the interest rate indicator will also serve as a source of important information.
Comments
KRWI
Just a constructive comment that you might remind readers more what the Kasriel Recession Warning Index is.
and if you are finding a pattern implication during deflationary recessions, I request you spell it out for us lay folk.
Great work but it's also dense. Don't want your findings lost of the lay folk.
The Kasriel Recession Warning Indicator is...
generated when BOTH of two conditions are met:
(1) year-over-year M1 money supply is greater than year-over-year CPI consumer inflation
AND
(2) 12 months previously the yield curve was inverted, i.e., long bonds (10 year) paid less interest than short term bonds (3 months).
The KRWI has been "infallible" since 1960.
After I look at interest rates (the #2 part of the indicator) tomorrow, I will go back and draw some conclusions. I'll try to make that as easy to read as possible.
it's a great read
but I know for those not familiar with LEI, M1, CPI, if you just put a little "refresher" brain box in the post, like you are writing a educational text....that's my suggestion.
This is one awesome analysis bottom line and if you manage to adapt KRWI (which might be implied) you gotta show this to some major economists for review, ya gotta.
This series is appreciated
And the constructive criticism about the basic information needed to follow the anaysis to be put in 'a box' in the post is a good idea
Thanks
I will try to put the basic information in as reader-friendly a form as I can, in the concluding post.