
Yesterday I discussed the need, given our deflationary recession, to examine the reliability of economic indicators during past periods of deflation, specifically to the period from 1920 to 1950. Today I begin that examination with the 1920s.
II. The Roaring Twenties: monetary indicators
The Roaring Twenties was an era of productivity- and debt- fueled urban prosperity that contemporaries called "The New Era" in which supposedly all of humanity's economic problems had been solved. Little did people at the time know of the severe hardships that awaited them when the bubble burst. Monetarily the decade was begun with the bursting of World War 1's high inflation (much like Paul Volker was to burst 1970s' inflation 60 years later), that settled into disinflation (declining inflation) and finally into deflation.
Today I will examine the monetary component of Paul Kasriel's "infallible recession indicator" as applied to the 1920s.
To start, let's take a look at the indicator (M1 vs. CPI) during the modern era examined by Kasriel, 1960-2008. M1 is in blue, CPI in red:
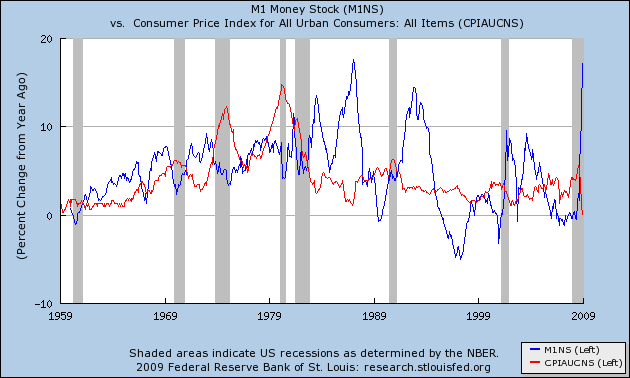
Notice that in the inflationary era, just by itself the indicator has an excellent record. CPI always exceeds M1 both before and during recessions, rising usually just after the end (the exception before now being the 2001 terroist attacks). Normally but not always the converse has signaled expansion (failing during the 1990s and most of this decade).
Now let's turn to the Roaring Twenties. In what periods did M1 money supply exceed consumer inflation (CPI), and in what periods is it less? How well do those periods correlate with periods of expansion and recession? CPI information comes from the Federal Reserve; monthly M1 figures are from Milton Friedman's "A Monetary History of the United States."
Here's the first graph, show the period from 1920-1927. As before, M1 is in blue, CPI is in red:

As indicated at the bottom of the graph, this period of the 1920s coincided with 3 recessons: the deflationary post World War 1 recession of January 1920- July 1921, a mild recession from May 1923-July 1924, and another slightly deflationary episode from October 1926-November 1927.
The monetary portion of the Kasriel indicator performed remarkably well during the period. YoY M1 first exceeded YoY CPI in April 1921 and on a quarterly basis continued that trend until September 1923-March 1924, when it again signaled recession. The indicator again signalled expansion until from May 1926-October 1927 M1 and CPI were essentially equal.
Note that the one "miss" takes place while M1 is declining during a deflation. That pattern will be important later. Aside from that, the indicator indicates both the onset and ending of recessions with only a few months' difference.
Next, let's look at the period 1928-29 that immediately preceded the Great Depression, which began in August 1929. In this graph the range of values is reduced, to highlight differences:

the monetary indicator appropriately signals the 1928 expansion. Thoroughout late 1928 to mid-1929 the indicator again shows M1 and CPI vitually equal, with M1 essentially flat with no growth whatsoever during late 1928 and early 1929, while a mild deflation also occurs, similar to the pattern of late 1926-early 1927. Again, we will return to this pattern later in our analysis.
Although the monetary indicator of M1 vs. CPI generally behaves well during the inflationary part of the 1920s, it most emphatically doe NOT follow the Kasriel pattern in predicting the Mother of All Deflationary Contractions.
To summarize, in the 1920s, the M1 vs. CPI indicator generally works well, with two differences from the Inflationary Era: (1) if anything, the indicator slightly lags signaling the start of recessions, and leads signaling expansions; and (2) when M1 is not growing -- when it is stagnant or declining -- it does not signal expansion even though it exceeds a CPI deflation.
For a fuller picture, we must explore the interest rate environment of the 1920s as well. But before we return to discuss the interest rate indicator, in my next installment we will look at this monetary indicator during the Great Depression and the post World War 2 deflationary recession.
Comments
link to part I
I think you're going to need a little summary with a link to each part. part I.
This is amazing work NDD. I am hoping other economists are reading this post for review because if you find a variable flaw in the Kasriel indicator, as far as I am aware that is completely new, novel and is original research. May I am wrong because I am certainly not a professional economist but you're running raw data and doing the analysis correctly from everything I know.
Very good work!