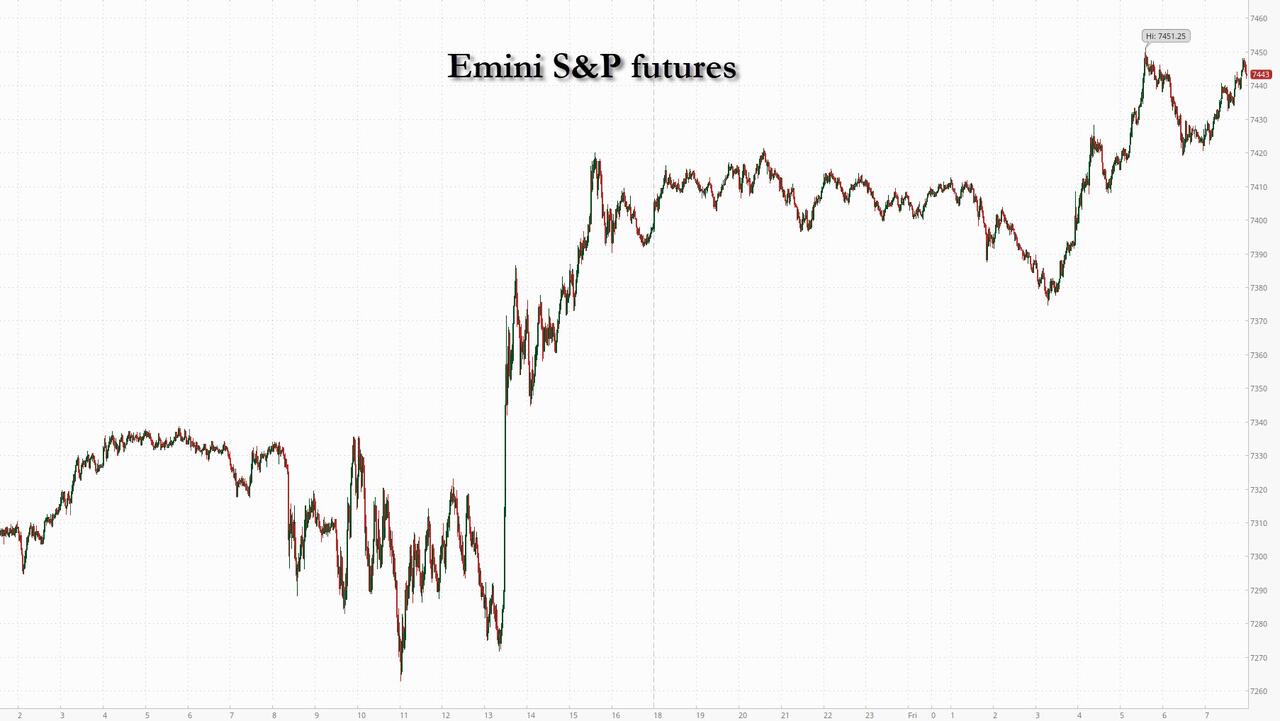
Futures Rally Amid Fresh Iran Peace Hopes, All Eyes On SpaceX
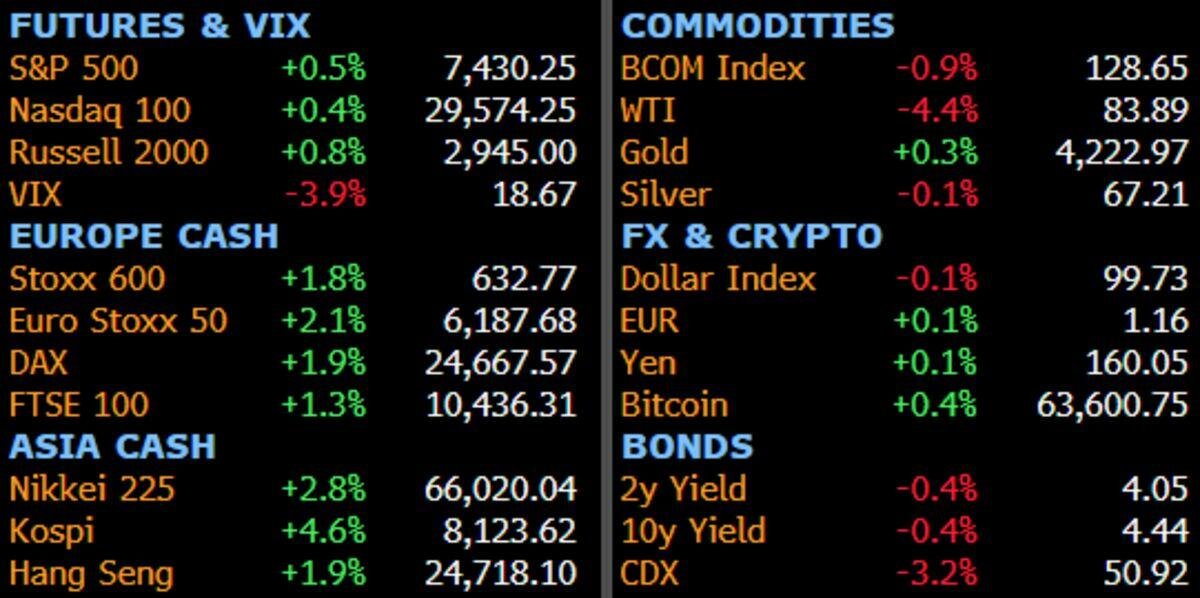
US stock futures and global markets are higher, extending their rally while oil hit the lowest level in months following fresh reports that the US and Iran are nearing a provisional agreement to end their war, even if top leadership has yet to sign off. Meanwhile, all eyes are on SpaceX - the world's biggest IPO- where shadow markets are pricing a spike of at least 35% for SpaceX on its debut, while online market see odds of a 30% close at roughly breakeven. As of 8:00am ET, S&P 500 futures rose 0.6% after the benchmark climbed 1.8% in the previous session. Pre-market, all Mag 7 are higher led by GOOGL and META. Treasuries held steady after Thursday's gain: 10Y yields are at 4.46%. The DXY dollar index fell 21bp to 99.639. Commodities are all lower: WTI fell $3.90 to $83.81 while Brent slid almost 4% to head for its first close below $88 a barrel since the first week of the war. Base/precious metals are unchanged; ags are all lower. Today's US economic data calendar includes June University of Michigan sentiment at 10am.

In premarket trading, Mag 7 stocks are all higher (Alphabet +1.3%, Meta +1%, Amazon +1%, Nvidia +0.6%, Microsoft +0.6%, Tesla +0.7%, Apple +0.4%)
- Rocket, satellite and space-linked companies gain after Elon Musk’s SpaceX raised $75 billion in its initial public offering. Movers include EchoStar +5% and Rocket Lab (RKLB) +4%.
- Adobe (ADBE) falls 6% after the company said its chief financial officer, Dan Durn, would depart, leaving the company without a top tier of veteran leadership after Chief Executive Officer Shantanu Narayen announced he would step aside.
- Advanced Micro Devices (AMD) gains 2% as Citi upgraded the chipmaker to buy, seeing the company as a key beneficiary of AI.
- Marvell Technology (MRVL) slips 1% after appointing Adobe’s Dan Durn as chief financial officer, succeeding Willem Meintjes.
- Travelers Cos. (TRV) slips 2% after Barclays cut its the recommendation on the property and casualty insurance company to underweight, saying that profit upside in the sector is getting more difficult to find.
In other corporate news, Adobe said its CFO would depart, leaving the company without a top tier of veteran leadership after the CEO announced in March that he would step aside. Flutter Entertainment, the owner of FanDuel, the largest player in US sports betting, plans to delist from trading in London
Sentiment was lifted overnight amid fresh expectations that the conflict with Iran is drawing to a close. In the latest developments on a draft deal, a Group of Seven official said an agreement could be signed as soon as Sunday. Iran’s foreign ministry told state-run media that a framework text was nearly finalized (full details here). The semi-official Mehr agency reported that the draft contained 14 provisions, including the reopening of the Strait of Hormuz and 60 days of negotiations on nuclear issues. Some have panned the MOU as one which concedes to Iran, giving the country monetary benefits upfront, while leaving the key negotiations for the back-end.
That said, traders are keen for an end to the more than 100-day war that has roiled global markets and caused the biggest oil-supply shock in history. While President Donald Trump signaled Thursday that a deal should get done shortly, traders have remained wary as previous bursts of optimism have ended in disappointment.
“Markets would believe the deal is reached when we have the actual agreement signed and the Strait of Hormuz can be opened,” said Mohit Kumar at Jefferies. “For now, markets are in relief mode that further escalation can be avoided.”
As for SpaceX, differences of opinion on the $75 billion IPO - the world's biggest - are easy to find on vision, valuation, opportunity and risks, but perhaps the most encouraging sign for traders may be the ability for the market to absorb record equity issuance. There’s been a record flood of equity issuance over the past two weeks, between SpaceX’s debut and Alphabet’s deal, with EPFR analysts saying it leaves “shrinking aggregate cash available to support broader equity valuations.” Meanwhile US equity funds had an 11th week of inflows, the longest streak since Dec., as tech funds had their biggest inflow ever, according to Bank of America.
On SpaceX valuation, “expensive” has never been a catalyst with Elon Musk, notes Amanda Lyons at Energy Group Capital, and “betting against his premium has been a losing trade for a decade.” Trading in the stock is likely to be a read for risk appetite while “the danger is that a genuine business and a quasi-religious premium are being sold in the same ticker, and most buyers aren’t separating the two,” Lyons adds.
“There appears to be continued investor appetite for technology-related growth stories, particularly those with exposure to AI,” said Tomás García-Purriños at Santander Asset Management. “The pipeline of expected IPOs in 2026 suggests that investor interest in technology, digital infrastructure and AI-related themes remains healthy, extending well beyond a handful of high-profile names.”
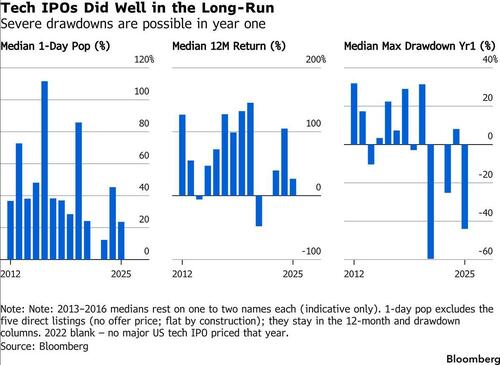
Bloomberg-compiled data covering 66 of the biggest US tech IPOs and direct listings since 2012 shows that an initial pop is near-universal. Among the pure IPOs, 86% closed above their offer price on day one, with a median 36% gain. After that, dispersion kicks in.
Elsewhere, overnight Bloomberg reported that global banks including Citi, JPMorgan and Goldman are said to be curbing hedge funds’ leveraged bets on Asia’s top chipmakers including SK Hynix and Samsung Electronics after a blistering rally this year raised concerns of a potential pullback.
Also overnight, Goldman Sachs cut its forecasts for crude oil prices next year by $5 a barrel on higher supply and lower demand. The US declared a power emergency in the southeastern US as forecasters warned of dangerous heat that’s likely to stress power grids along the country’s east coast.
Traders in Europe and Asia raced to catch up with Wall Street’s chipmaker-led gains from Thursday. The Stoxx 600 rose 1.5% on optimism about a deal between the US and Iran builds, prompted by President Trump scrapping strikes and extended by a report that a draft deal is under discussion, though one that still needs approval from authorities. Here are the biggest movers Friday:
- Shares in European energy and fossil-fuel firms fall while airlines gain after President Donald Trump said a peace deal with Iran could be signed as soon as the weekend, comments that pushed down oil prices
- Homebuilders are among the best-performing stocks in the UK on Friday as money markets pare bets on BOE rate hikes and swap rates used to price mortgages decline. The move is driven by sliding oil prices on Middle East optimism
- FlatexDEGIRO shares jump as much as 7.5% after the online brokerage was awarded a new overweight rating at Barclays following the stock’s de-rating this year, while Avanza rises as much as 5.3% after being upgraded
- Getinge gains as much as 4.9%, the most since Oct. 21, after Kepler Cheuvreux upgraded the stock to buy from hold, citing an improving outlook for the Swedish health-care equipment firm
- Halma shares rise as much as 4.3%, rebounding from a two-month low following the record 15% drop in the share price on Thursday after the UK industrial group’s guidance for its Photonics business fell short of expectations
- Nokia gains as much as 6.7% after JPMorgan raised its PT on the company, saying its operating profit in 2028 can beat the company’s own guidance — issued during the capital markets day in November — by more than 50%
- Colruyt shares rise as much as 8.6% as Oddo BHF analyst Robert Jan Vos upgrades the retailer to outperform from neutral and lifts his price target ahead of full-year results on June 16 in anticipation of continued margin revival
- Exail shares fall as much as 21% as the company disagrees with financial partner ICG over the size of a payment for bonds and preferred shares as ICG exits its investment in the French defense firm
- Acciona Energía shares are 9.7% higher Friday in Madrid trading following a Cinco Días report that Brookfield, KKR are among investors that Acciona has reached out to gauge interest on its renewables unit
- Glanbia drops as much as 4.3% to €21.62 after biggest shareholder Tirlán Co-Operative Society sold down its stake in the Irish manufacturer of workout supplements and energy bars
- LPP slumps as much as 7.8%, the most in a month, after the Polish fashion retailer slowed its expansion in response to rising cannibalization risk within its key Sinsay brand
Asian stocks rallied as technology shares rebounded, helped by President Donald Trump’s claim that a deal with Iran was close.
The MSCI Asia Pacific Index climbed as much as 3.5%, the most in more than two months, before paring some gains. Chipmakers Samsung, SK Hynix and TSMC were among the biggest contributors. South Korea’s Kospi led gains among regional benchmarks, closing 4.6% higher after gaining as much as 8.6% earlier. Most other markets were also in the green. Here Are the Most Notable Movers
- Chow Tai Fook’s shares surge as much as 13%, the most since June 2019, after its full-year earnings and FY27 guidance both beat estimates. The gold retailer saw stronger growth in April–May, driven by a recovery in demand for weight-based gold jewelry amid a retreat in gold prices, according to analysts.
In FX, the Bloomberg Dollar Spot Index only seeing modest moves after a four-day run of losses and now little changed, having wiped out its gains on the Iran headlines.
In rates, treasuries are marginally richer across the curve, broadly holding late gains seen on Thursday, following latest developments on a draft US-Iran peace deal which includes a G7 official saying an agreement could be signed as soon as Sunday. US yields richer by around 1bp across belly of the curve with 10-year trading at 4.455%, close to Thursday’s closing levels, as oil extended declines, continuing to underpin Treasuries and support stocks. Bunds and gilts outperform, catching up with Thursday’s late Treasuries gains after the European close. IG dollar issuance slate includes a couple of deals. Citibank’s $6.25b transaction led a three-deal $10.25b slate on Thursday. Issuers paid less than 1bp on deals that were 4.8 times covered. Weekly volume at $27b is just shy of the $30b dealers’ projections
In commodities, WTI futures lower by 3.4% on the day while Brent heads for its first close below $88 a barrel since the first week of the war. Gold was little changed and Bitcoin posted small gains.
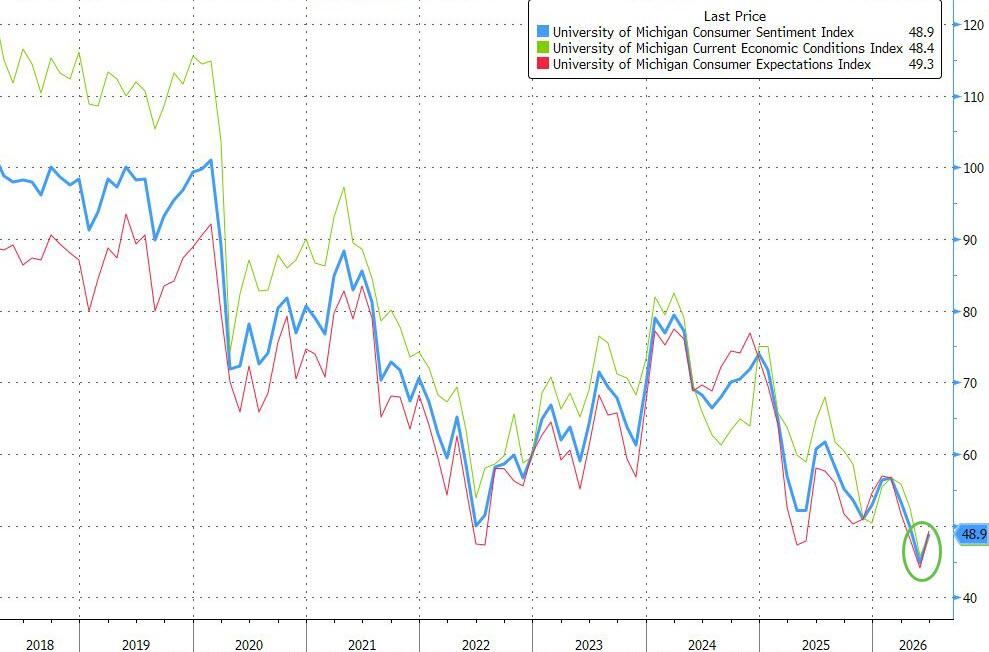
Today's US economic data calendar includes June University of Michigan sentiment at 10am.
Market Snapshot
Top Overnight News
- The US and Iran moved closer to an agreement that would reopen the Strait of Hormuz, potentially around next week’s G-7 meeting, according to senior officials. The US is to withdraw forces from the area surrounding Iran under a potential deal, Iran’s semi-official news agency Mehr reported. BBG
- The United States plans to significantly reduce the aircraft and warships that it makes available for NATO operations in Europe, according to two senior European officials, accelerating America’s effort to scale down the protection it has offered to European allies for eight decades. NYT
- Global banks are curbing hedge funds’ leveraged bets on Asia’s top chipmakers including SK Hynix Inc. and Samsung Electronics Co. after a blistering rally this year raised concerns of a potential pullback. BBG
- Nvidia has told Chinese clients that its new "Vera" central processors for AI data centers could be available as soon as August and that they can begin placing orders, three sources familiar with the matter said. BBG
- China told big state-owned banks to reduce their lending in the interbank market, according to people familiar with the matter, in an effort to prevent borrowing costs from drifting too far below the policy interest rate. BBG
- Chinese investors are rushing to Hong Kong to open bank accounts and buy investment products, as Beijing cracks down on cross-border capital flows in a shift that shareholders fear may dent returns. FT
- The ECB is prepared to raise rates again next month if the shock from the war requires it, Governing Council member Joachim Nagel said. BBG
- The US insurance industry’s standard setter has begun to examine credit risks linked to data center projects, which are increasingly showing up in insurers’ investment portfolios. FT
- Big companies and startups, chafing at rapidly escalating artificial intelligence costs, are increasingly turning to tools that tap in to cheaper AI models, including some from China. That’s raising pressure on industry leaders OpenAI and Anthropic to lower their prices, a prospect that could hurt their ability to grow into profitable enterprises. WSJ
- US Senate Banking Committee is weighing a markup of export control legislation. It could tee up the bills for inclusion in the next annual defense policy package, no final decision has been made yet: Punchbowl
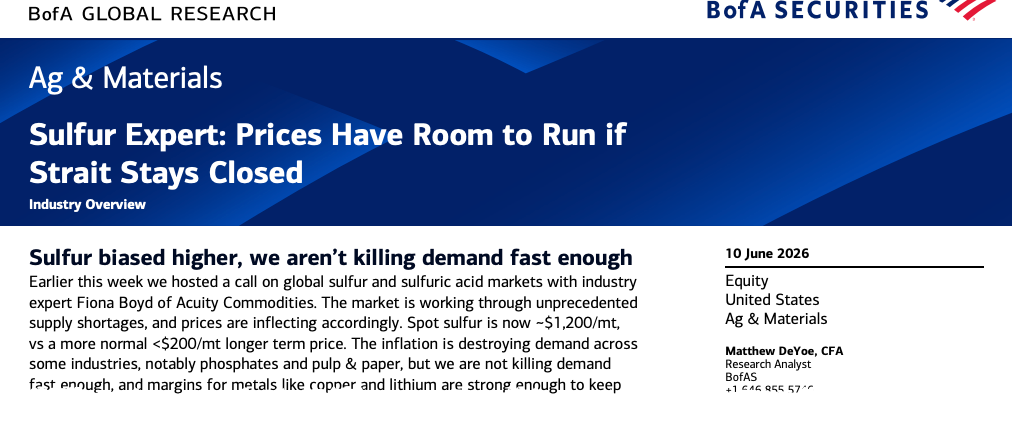
- US President Trump said regarding fertilizer prices, that they might look into federal aid, and are looking at doing some form of help.
- BofA weekly flow data shows USD 20.8bln into bonds (59th straight week of inflows), USD 2.5bln out of cash, USD 31.5bln into stocks, USD 0.7bln out of crypto (record inflows over 5 weeks), USD 2.3bln out of gold (4th straight week of outflows).
Iran News
- Iranian media Mehr News reported that the US-Iran 14-point MoU includes a US commitment to lift sanctions, withdraw its forces from around Iran, lift the naval blockade, reopen the Strait of Hormuz, lift oil sanctions, and release frozen Iranian funds; nuclear issue pushed back by 60 days for final agreement. Additionally, the US is required to present a plan to rebuild Iran’s economy, while the final negotiations between the two countries should focus on nuclear and economic issues, without discussing Iran’s missile program. This text still needs to be reviewed and finalized by the relevant institutions in Iran.
- The US-Iran MoU is likely to be signed next week, according to CBS citing sources, with Bloomberg later reporting that it could happen at the G7 meeting in Geneva next week. First steps include ensuring "freedom of trade" by demining and opening the Strait of Hormuz. The signing would kick off 60 days of talks to negotiate details. In principle, Iran would commit to a lockout of 15-20 years during which it would not enrich uranium and would dismantle its nuclear sites. In exchange for taking these steps, Iran would receive financial relief staggered over time and sequenced to correspond with compliance.
- US President Trump said he understands that Iran’s Supreme Leader has approved the deal and that lifting the blockade is part of the Iran deal, while he added that Iran will not have a nuclear weapon and that they want to make a deal a lot more than he does. Trump added it's a very strong MOU, they found Iran to be rational, and they will make a deal. Furthermore, he said the Strait will open immediately upon MOU signing, maybe Saturday or Monday, but doesn't want to set a deadline for the deal, and stated a Kharg Island deal would be off the table now.
- US President Trump said at a virtual campaign rally that they settled up with Iran and it is pretty much completed, while they got everything they wanted and claimed they ended the war with Iran.
- Israeli PM Netanyahu held a call with US President Trump on Thursday night regarding the possibility of a pending peace deal between the US and Iran, according to CBS News.
- Airplanes associated with US VP Vance's advance team are moving ahead of potential Iran MoU signing, according to New York Post reporter.
- Iran state media said Tehran would not cede control of Hormuz under draft US deal, AFP reported.
- Iranian Foreign Ministry spokesperson said the issues raised about the agreement are speculation and the issue has not been finalised, while it added that the situation in the Strait of Hormuz is less secure due to US actions and that what is being said about the time and place of signing the agreement is media speculation. Furthermore, the spokesperson said that Iran has so far not reached a final conclusion about the agreement, but stated that the text of the agreement is almost ready.
- Sources cited by Al Hadath said Iran has given final approval, which Qatar conveyed to the US.
- Iranian state media reported that explosions heard in Sirik was related to a confrontation with a vessel that violated regulations whilst attempting to pass through the Strait of Hormuz.
- Israeli airstrike reported in Jebchit, southern Lebanon, according to Al Araby.
A more detailed look at global markets courtesy of Newsquawk
- APAC stocks rallied following on from the gains on Wall St, after President Trump cancelled planned strikes on Iran and touted a US-Iran deal, which could be signed as soon as the weekend and would open the Strait of Hormuz, while Trump claimed the US ended the war with Iran and he understood that Iran’s Supreme Leader has approved the deal. However, Iran pushed back on this as a Foreign Ministry spokesperson stated the issues raised about the agreement are speculation and that Iran has so far not reached a final conclusion about the agreement, but acknowledged that the text of the deal was almost ready.
- ASX 200 climbed higher as outperformance in mining, materials and resources led the advances, while energy was pressured due to the drop in oil prices, and defensives also lagged amid the risk-on environment.
- Nikkei 225 surged at the open and briefly tested the 67,000 level, with the index helped by lower oil prices and with tech and mining stocks sitting comfortably among the list of biggest gainers.
- Hang Seng and Shanghai Comp joined in on the euphoria with mining stocks among the notable gainers, while Chow Tai Fook was front-running the advances after it reported record full-year profit.
Top Asian News
- China tells big banks to curb interbank loans to ease cash glut.
- Japanese Finance Minister Katayama said they are aiming to broaden retail JGB offerings and that retail Japanese government bonds remain unappreciated by households, while she stated that no impact is expected on the central bank policy meeting after BoJ Governor Ueda was hospitalised.
- India is willing to let fiscal gap widen to as much as 4.8% of GDP from a previous 4.3%, according to Bloomberg
European bourses (STOXX 600 +1.8%) start the last trading day of the week on a firmer footing and have completely reversed the losses seen at the start of the week. This comes on hopes of a US-Iran deal, with US President Trump stating that it could be signed as early as this weekend in Europe. Further upside was spurred after Mehr News reported that the MoU with the US includes reopening the Strait of Hormuz, lifting oil sanctions, and releasing frozen Iranian funds. European sectors are entirely in the green bar Energy (-3.1%). Travel & Leisure (+5.2%) is the clear outperformer, followed by Banks (+4.2%) and Consumer Products & Services (+3.7%). Cyclicals have been affected the most since the start of the Iran war, so hopes of an end would benefit these sectors the most.
Top European News
- Bundesbank sees German GDP growth at 0.5% in 2026, 0.8% in 2027; German inflation seen at 2.9% in 2026, 2.7% in 2027.
FX
- Snapshot: DXY is incrementally firmer, whilst G10s mixed vs the USD this morning. The tentative action comes after US President Trump claimed that he had a deal with Iran, and that the signing of the MoU would probably happen in Europe. However, the Iranians pushed back on this claim. This morning, a Mehr report revealing the details of the 14-point plan garnered some attention, which helped boost global sentiment - though action was fairly muted in the FX space.
- DXY is slightly firmer today despite significantly lower oil prices after a number of geopolitical updates in the last 24 hours. (See commodities for more details). In recent trade, USD was hit as details of the 14-point US-Iran MoU accelerated the risk-on bias. On this reporting, DXY moved towards Thursday's lows of 99.58, currently 99.72 at the time of writing. Focus for the remainder of the day shifts to the UoM Sentiment survey, but market participants will likely be more attentive of the geopolitical environment and potentially some early positioning heading into a weekend which could see a deal between US-Iran be signed.
- EUR and GBP trade has chopped on either side of the unchanged mark this morning. The single currency has had a number of ECB speak to contend with, but by in-large has been largely in-fitting with President Lagarde’s comments on Thursday. A notable Bloomberg sources piece suggested that some policymakers could see a hike as soon as July. Elsewhere, the GBP had a weak growth report to digest – overall it does little to shift the mood heading into the next week’s meeting, but will exacerbate the growth woes had the Bank.
- NOK is the worst G10 performer on account of lower oil prices as participants assess implications for Terms of Trade and the Norges Bank. Popular carry trade NOK/SEK has seen downside in excess of a percent today due to the above. NOK/SEK slipped below par, to mark a session low of 0.9882.
Central Banks
- ECB's Nagel said all policy options remain on the table for July while adding that the ECB is prepared to respond if required.
- ECB's Makhlouf said we need to get ahead of inflation and are seeing more broad-based inflation impact. It would be a mistake for us to do nothing.
- ECB's Kocher said the war's impact on price trends are increasingly clear and he does not expect inflation to match 2022 or 2023 levels. Will act decisively to ensure 2% mid-term target.
- ECB's Dolenc said the rate hike is just enough for now to follow the baseline, and they had a robust set of data to make a decision. Dolenc also stated that it is pretty obvious inflation will be higher and growth lower, while services inflation is stubborn and hard to fight.
Fixed Income
- Global fixed benchmarks are entirely in the green and currently hold towards highs. Strength, which has been facilitated by lower energy prices after US President Trump claimed that he had a deal with Iran, and that the signing of the MoU would probably happen in Europe. However, the Iranians pushed back on this claim. The bullish bias then extended after Iran-affiliated, Mehr News, reported the details of the US-Iran 14-point MoU. This spurred another bout of pressure in the energy complex, which in-turn weighed on global yields.
- USTs (+4+ ticks) gain, and hold at the upper end of a 109-19 to 109-29 range. Action which has been facilitated by the positive geopolitical mood music, but still remains the underperformer vs peers. That can potentially be explained by the ongoing hawkish repricing at the Fed, heading to the Bank’s policy announcement next week. Elsewhere, yields are lower across the curve with underperformance in the short-end/belly; the 10yr currently holds at 4.43%, marking the WTD low. Should the geopolitical environment materially improve in the coming days, and the Strait entirely opens up, the 10yr could dip its head back towards support levels at 4.33% and then 4.25%. Do note that the 10yr resided below the 4.00% mark before the Iran conflict started.
- Bunds (+43 ticks) and Gilts (+87 ticks) both follow the bullish bias, with the latter outperforming given its relatively high dependence on external energy and poor domestic growth data. For EGBs, there have been a number of ECB speakers this morning following the Bank’s decision to hike rates on Thursday. Most have echoed the comments made by President Lagarde at her presser; focus has been on a Bloomberg report, which suggested that some ECB members see another hike as soon as July.
- For UK paper, the GDP release this morning indicated that the UK economy shrank by 0.1% in April, amidst the Iranian war. This will only exacerbate growth woes for some policymakers at the BoE, where policymakers are set to meet next week, expected to keep rates on hold.
Commodities
- On Thursday, US President Trump said a deal could be signed with Iran as soon as this weekend in Europe, following an earlier post on Truth Social that the US was going to strike Iran hard for the third straight day and then later pulling back the threat. Trump said VP Vance would attend if the deal materialises and added that the Iranian Supreme Leader had agreed to a deal. The deal was described as a very strong MoU which would restart shipping in the Strait and include commitments from Tehran to not pursue a nuclear weapon.
- Markets were awaiting any kind of confirmation from Iranian media that the MoU has been received. Mehr News reported the 14-point MoU includes the reopening of the Strait of Hormuz, lifting oil sanctions, and releasing frozen Iranian funds. (Full 14 points on the headline feed) Awaiting official commentary from the Iranian government on the MoU.
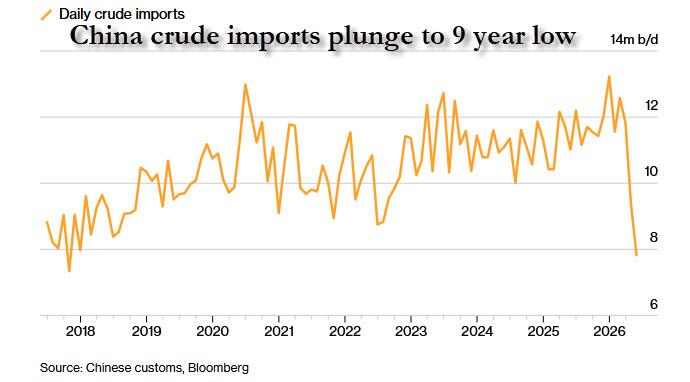
- Crude futures were already on the softer side before the Mehr news report, but it has given an additional catalyst for further downside. WTI Jul'26 slides below a key support range of USD 84.46-85.95/bbl, currently trading at the bottom of USD 83.20-86.98/bbl range. For Brent Aug'26, the benchmark trades slips below the USD 86/bbl handle (USD 85.80-89.72/bbl).
- Precious metals trade in narrow ranges after rebounding in excess of 3% in Thursday's session. Spot gold oscillates in a USD 4170-4247/oz range. Given the positive news of a potential US-Iran deal, worries of higher inflation/rates due to energy prices may temper and result in some unwinding of the hawkish rate bets by the Fed.
- 3M LME Copper bids higher, currently trading in a USD 13.6k-13.72k/t range, amid the positive tone. The red metal gapped higher alongside gains in Asia-Pac equities and held amid constructive reporting.
- Venezuela has signed five agreements with Shell (SHEL LN) to advance oil and gas projects, which includes the Co.'s participation in the 5tln cubic-feet Loran offshore gas field.
- JPMorgan still expects aluminium to reach USD 4k/t, now forecasting an average price of USD 3750/t in H2'26.
US Event calendar
- 10:00 am: Jun P U. of Mich. Sentiment, est. 46, prior 44.8
DB's Jim Reid concludes the overnight wrap
Happy birthday to me. I’m taking most of today off to catch up with an old close friend I now see far less than I should, largely due to work commitments and my ongoing role as an on-demand Uber driver for my children. The plan involves a long local hike and a long non boozy lunch. Yes, my wife and I are actually going to spend some time together. Hopefully we won't run out of things to talk about within the first few hundred yards.
There’s no shortage of topics to discuss in the financial world right now, as sentiment and newsflow around tech and the Iran war continue to swing 180 degrees at short notice. Indeed, the past 24 hours has seen a sharp reversal in the trajectory of the US–Iran conflict, as mounting hopes of a deal have seen Brent crude fall -1.62% overnight, leaving it on track for a 3-month low of $88.80/bbl. So that’s led to a huge rally across bonds and equities, as lower oil prices have eased fears about a prolonged stagflationary shock.
The picture had looked very different this time yesterday, as we woke up to a second day of US strikes on Iran. Moreover, Trump went onto say that that the US would continue to hit Iran for a third day, and take control of Kharg island and other oil infrastructure. But a few hours later, after European markets had closed, that was suddenly reversed. In a post Trump said that discussions with Iran “have been brought to the highest level of Iranian leadership and approved”, and that he was cancelling “the scheduled strikes and bombings against Iran this evening. The post also said that “final points have been, in both concept and great detail, approved by all parties involved”, and that a time and place for the signing would be “announced shortly”. Later on, Trump followed this up, saying the US had “made a great settlement of the war with Iran”, and that the deal could be signed over the weekend in Europe, and that the Strait of Hormuz would be reopened to shipping once an agreement is signed.
The market reaction to the news was swift, with Brent crude down -2.92% yesterday to $90.38/bbl, and that’s been followed up by an overnight decline of -1.75% to $88.80/bbl. Moreover, the entire oil futures curve moved lower, with the 6-month Brent future down to $83.28/bbl this morning, which would be its lowest closing level since April. And in turn, we’ve seen a huge wave of optimism in Asian equities this morning, with strong gains for the Nikkei (+3.37%), the KOSPI (+8.32%), the Hang Seng (+2.02%), the CSI 300 (+1.53%) and the Shanghai Comp (+1.56%).
With oil prices coming down sharply, alongside hopes that the Strait of Hormuz will reopen, that’s seen investors price out the chance of rapid rate hikes this year. Indeed, as we go to press, markets are now pricing in just a 77% chance of a Fed rate hike by December, having been fully priced in earlier this week. In fact, it’s not until the March 2027 meeting that a hike is fully priced in. So that dovish repricing helped US Treasuries to surge, with the 2yr yield (-8.1bps) down to 4.06% by the close, whilst the 10yr yield (-9.1bps) fell to 4.46%.
For equities there was also a huge surge, as the prospect of lower inflation and fewer rate hikes led to growing optimism on the near-term outlook. So the S&P 500 (+1.75%) posted its biggest jump in the last two months, whilst futures (+0.10%) are pointing to further gains today. And there was a huge surge for some of the recent laggards, with the Philly semiconductor index up +7.91%, the NASDAQ up +2.54%, and the small-cap Russell 2000 up +3.02%. Metals also rallied, with copper up +2.08%, gold up +3.48%, whilst silver (+6.23%) once again traded with a higher beta.
Aside from the Middle East news, the big story yesterday was the first ECB rate hike since 2023, with a 25bp move that lifted their deposit rate to 2.25%. They became the biggest central bank yet to hike after the Middle East energy shock, joining others like Australia and Norway who’d already hiked. Moreover, there were some hawkish undertones, as Lagarde described the hike as "completely warranted and justified”, even in the ECB’s milder scenario, and noted how the inflation shock was becoming broader in nature. Indeed, the ECB lifted their inflation projections, and now expect headline inflation to average 3.0% in 2026 (prev. +2.6%) with core inflation projected to stay above 2% all the way to 2028 (+2.2%).
Interestingly, we had a little conflict in the usual sources stories that came out after, although that seemed to be more in the headline framing than the details. So Bloomberg’s headline suggested that ECB officials weren’t ruling out another hike as soon as the next meeting in July, but a Reuters story said that the ECB felt a material surge in oil prices was necessary to justify a July hike. Nevertheless, both suggested that both a hold and a hike were possible, and unsurprisingly, Lagarde avoided being drawn on the timing of further hikes. Our own European economists are sticking to their view of one more rate hike to 2.50% in September (see their reaction note here Focus Europe: ECB Reaction: A robust hike) with their economic forecasts being softer than the ECB's. Interestingly they say that another hike to 2.75% is more likely than stopping here at 2.25%.
Given that the hike was fully priced in already, European bonds still put in a decent performance with yields on 10yr bunds (-4.4bps), OATs (-4.8bps) and BTPs (-5.3bps) all retracing the previous day’s losses. Moreover, investors also priced in a more dovish path for the ECB over the months ahead. Equities put in a strong performance too, even before the news of a potential US-Iran deal, with the Stoxx 600 (+0.54%) ending a run of 4 consecutive declines, alongside gains for the FTSE 100 (+0.48%), CAC 40 (+0.48%) and the DAX (+0.06%).
Another big story, prior to the Iran news, was Oracle earnings. That was out after Wednesday’s close, but yesterday their share price fell -8.53% in response, as their quarterly capex spend was much higher than forecast. So that renewed investor concerns about the sustainability of AI infrastructure spending. For reference, Oracle has become the largest non-bank issuer in the Bloomberg USD Investment Grade index over the last year, and has now signaled another $20bn of debt issuance over the next 4 quarters. Meanwhile, Oracle is now down -26.4% since its intra-day peak on June 1st, after being up +31.0% in the 3 business days before it.
Otherwise, the main US story was that PPI inflation ran hotter than expected in May, with headline PPI up +1.1% on the month (vs. +0.7% expected). However, there was a downward revision of three-tenths to the April number, and the PPI measure excluding food and energy was only at +0.4% (vs. +0.5% expected). Taken together, this week's CPI and PPI have led our US economists to increase their May core PCE forecast to 0.37%, a few basis points higher than before the two releases due to the subcomponent breakdowns. But even though inflation was running hot, the labour market data actually came in on the weaker side, with the weekly initial jobless claims up to 229k in the week ending June 6 (vs. 220k expected), which is their highest in 4 months.
Finally, one interesting story bubbling under the surface is the fear of one of the strongest El Niño’s on record emerging around the Pacific equator. That’s where unusually warm sea surface temperatures in the eastern Pacific cause the Pacific jet stream to move south, which creates changes in weather patterns and ecosystems. But unfortunately, El Niño events are also correlated with a higher frequency of natural disasters, such as flooding, so usually lead to concern about things like food harvests and higher prices. Those concerns continued yesterday, as the US Climate Prediction Center published a report, saying that the probability of a strong El Niño is over 65% for the end of this year and a very strong one at nearly 40%.
Looking at the day ahead now, the main data releases will be the US University of Michigan survey for June, the UK’s monthly GDP for April, and Canada’s Q1 capacity utilisation rate. We’ll also hear the ECB’s Kocher and Nagel speak.
Tyler Durden
Fri, 06/12/2026 - 08:23


Recent comments