
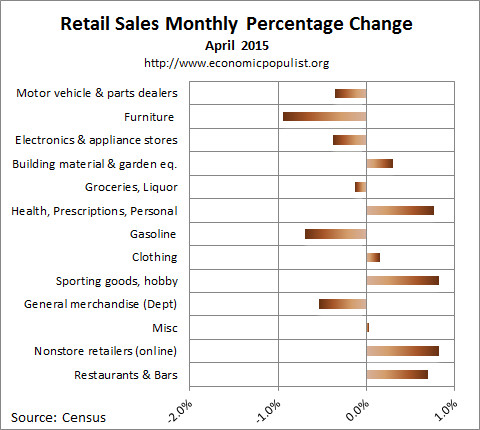
April Retail Sales has assuredly disappointed Wall Street and is just one report in a series indicating the U.S. economy has gone into standby mode. Retail sales had no growth and even excluding gasoline sales only grew 0.1%. Autos & parts dropped -0.4% for the month. Without autos & parts sales, April retail sales increased 0.1%. Gasoline sales declined by -0.7%. Sporting goods & hobby stores showed a 0.8% increase but department stories sales declined by -2.2%. Retail sales have now increased only 0.9% from a year ago and that's really not great. Worse, all of 2014 retail sales were revised downward by -1.2% than previously reported. Retail sales are reported by dollars, not by volume with price changes removed. Retail trade sales are retail sales minus food and beverage services and these sales were down -0.1% for the month. Retail trade sales includes gasoline.
Total April retail sales were $436.8 billion. Below are the retail sales categories monthly percentage changes. These numbers are seasonally adjusted. General Merchandise includes Walmart, super centers, Costco and so on. Furniture dropped by -0.9%.
Below is a graph of just auto sales. Auto sales and parts sales are huge part of retail sales and declined -0.4% for the month and for autos alone, -0.3%. For the year, motor vehicle sales have increased 5.1%. Autos & parts together have increased 4.5%

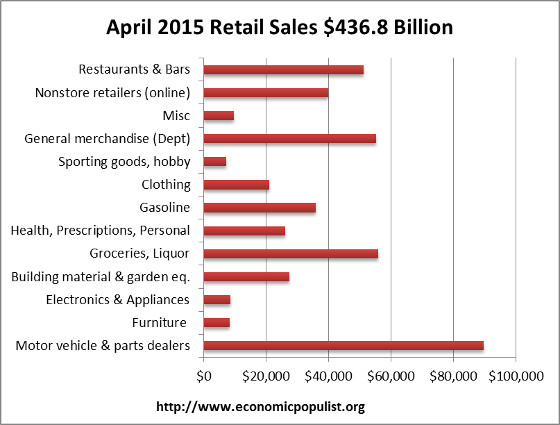
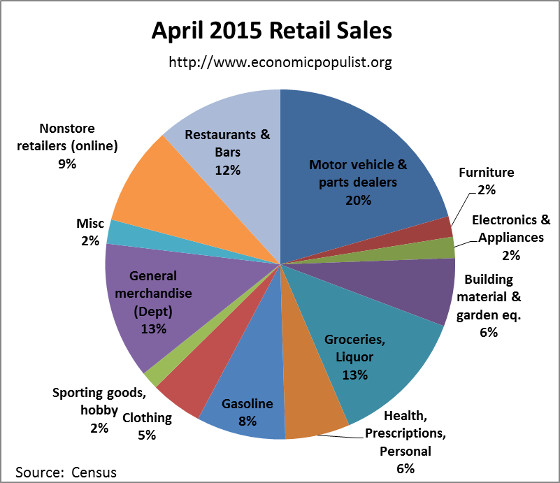
Below are the retail sales categories by dollar amounts. Autos and parts is more than groceries and almost rivals groceries, booze and eating out combined.
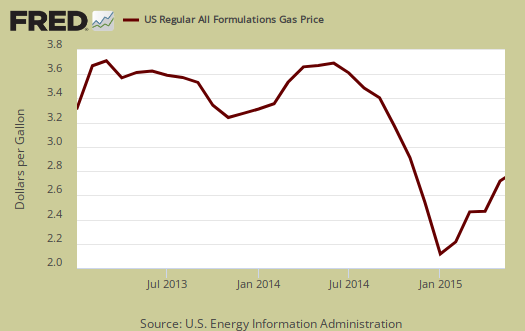
Graphed below are weekly regular gasoline prices, so one can see what happened to gas prices in April. Gasoline station sales are down a whopping -22.0% from a year ago. Gas prices are projected to be the lowest since 2009 for that summer roadtrip, although lately one must wonder where that projection is coming from
The below pie chart breaks down the monthly seasonally adjusted retail sales by category as a percentage of total April sales by dollar amounts. The dependency on autos in this country for retail sales is astounding.
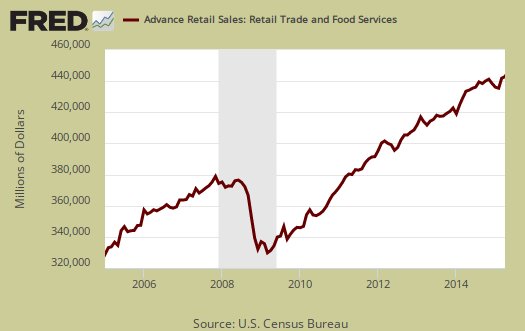
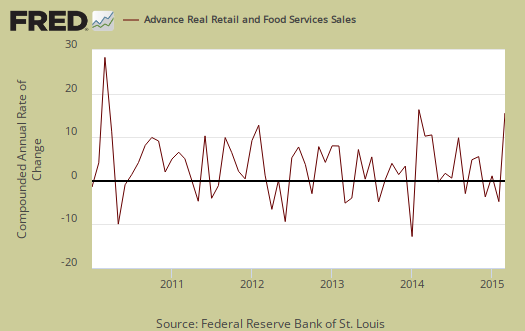
Retail sales correlates to personal consumption, which in turn is about 70% of GDP growth. ( GDP has inflation removed from it's numbers). Below is the graph of retail sales in real dollars, or adjusted for inflation, so one gets a sense of volume versus price increases. Below is the annualized monthly percentage change in real retail sales, monthly, up to March 2015. This is a crude estimate since CPI is used instead of individual category inflation indexes. The below graph can give some insight as to what consumer spending might shape up to be for Q2 2015 and as we can see things are not looking good so far.
Below is a graph of real PCE against real retail sales, quarterly, up to Q1 2015. See how closely the two track each other? PCE almost looks like a low pass filter, an averaging, removal of "spikes", of real retail sales. Here are our overviews for PCE. Here are our overviews of GDP.

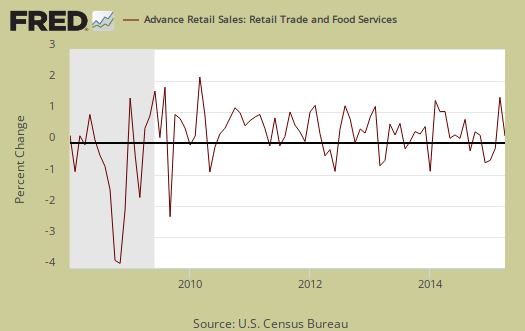
Retail sales are not adjusted for price increases, not reported in real dollars. Real economic growth adjusts for inflation. Retail sales has variance, margins of error, and is often revised as more raw data comes into the U.S. Department of Commerce (Census division). For example, this report has an error margin of ±0.5%. Data is reported via surveys, and is net revenues of retail stores, outlets. Online retail net revenues are asked in a separate survey of large retail companies (big box marts). This is also the advanced report. To keep the monthly nominal percentage changes in perspective, below is the graph of monthly percentage changes of retail sales since 2008.
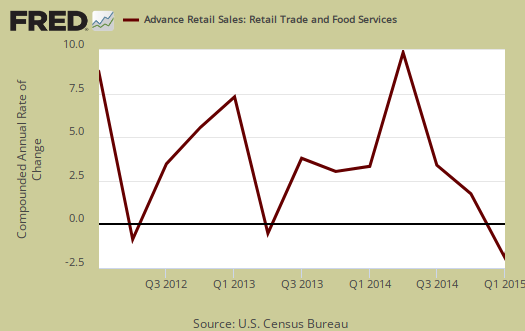
For the three month moving average, from February to April in comparison to the November through January average, retail sales have decreased by -0.6%. The retail sales three month moving average in comparison to a year ago is up 1.5%. Overall as shown the below graph of quarterly annualized retail sales percentage change, up to Q1 2015. Adjusted for prices and inflation is what matters for economic growth yet such a large, annualized, nominal quarterly decline does not bode well.
Advance reports almost always are revised the next month as more raw sales data is collected by the Census. In other words, do not get married to these figures, they will surely be revised and seasonal adjustments are aggregate.
Here are past retail sales overviews, unrevised.
It's a puzzle...
With all this fine weather we've been having lately, and the low gas prices, I had expected better.
March revisions
i seem to be the only one covering the revisions to last month...here they are:
sales at car dealers, which were originally reported as up 2.8%, have been revised to show March growth of 3.1%...as expected, sales at gas stations were revised from a decrease of 0.6% to an increase of 0.4%, although with a 3.9% increase in gas prices. we frankly expected a greater revision...other large upward revisions included sales at department stores, which were originally reported 1.4% higher, are now seen to have been 2.7% higher, and sales at specialty stores, such as sporting goods, book and music stores, which were originally reported as up 0.2%, are now seen to have increased 1.4%...other upwards revisions of less than 0.5% were seen by furniture stores, building material and garden supply stores, groceries, non-store retailers, and bars and restaurants....meanwhile, sales at miscellaneous stores, first reported up 1.7%, have been revised to barely growing in March at 0.1%, while sales at electronics and appliance stores were revised 0.4% lower, sales at clothing stores were revised 0.3% lower, and drug store sales were unrevised...
rjs
retail sales revisions, benchmarks
I wouldn't be that shocked by just March, the real story is the entire 2014 being revised downward, plus this year so far is much worse.