
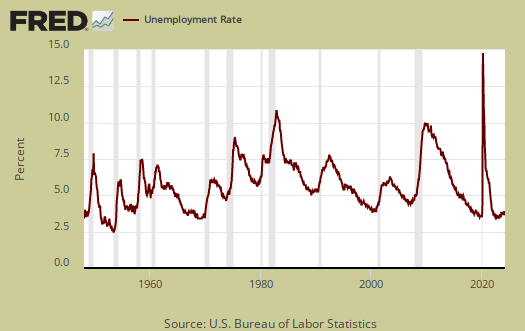
The June employment report brings some OMG, jaw dropping, are you kidding me numbers. Over 640,000 dropped out of the labor force. As a result, the unemployment rate declined two tenths of a percentage point to 5.3%. The labor participation rate dropped by -0.3 percentage points to 62.6%. This new low of a labor participation rate has not seen since October 1977 when women and minorities were still were not in the workforce extensively. While the United States does have baby boomers entering retirement, these figures are horrific.
This article overviews and graphs the statistics from the Employment report Household Survey also known as CPS, or current population survey. The CPS survey tells us about people employed, not employed, looking for work and not counted at all. The household survey has large swings on a monthly basis as well as a large margin of sampling error. This part of the employment report is not about actual jobs gained.
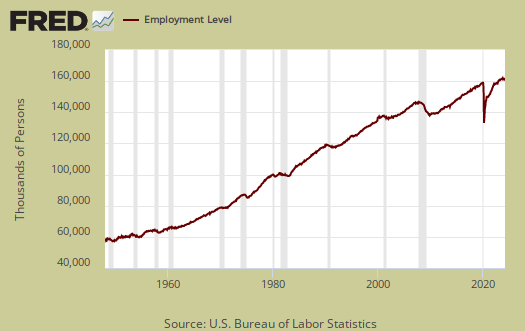
Those employed dropped by -56,000 this month, below the margin of error yet with the other statistics, more news where one shakes their head in disbelief. From a year ago, the employed has increased by 2.5 million.
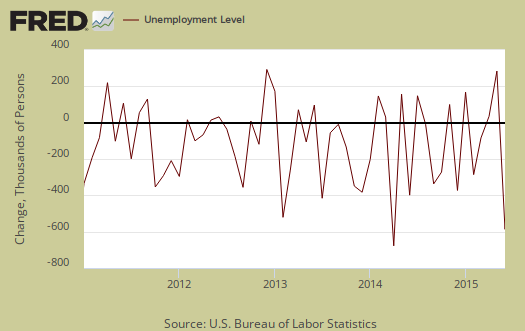
Those unemployed decreased by -375,000 to stand at 8,299,000. From a year ago the unemployed has decreased by -1.154 million. Below is the month change in unemployed and as we can see, this number normally swings wildly on a month to month basis.
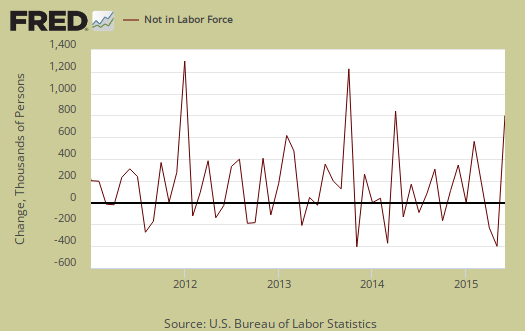
Those not in the labor force increased by 640,000 to 93,626,000. The below graph is the monthly change of the not in the labor force ranks. Those not in the labor force has increased by 1,512,000 in the past year. We are going to dig deeper into the labor participation rate for it seems absurd to think this is just baby boomer retirees.
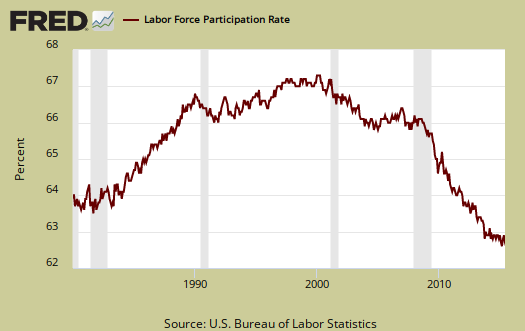
The labor participation rate is at 62.6%, a -0.3 change from last month and as noted, a rate not this low since October 1977. In the 1970's equal opportunity and pay were still being debated as women and minorities were still only allowed on the lowest rungs of the workplace hierarchy.
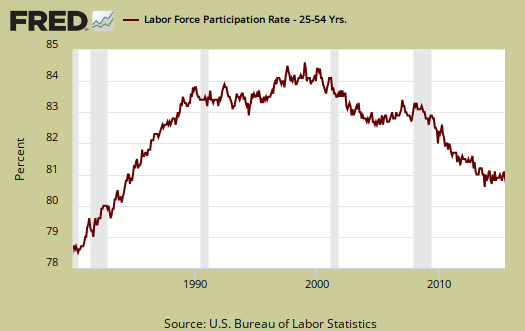
To see the labor participation rate cannot be explained away by retiring baby boomers, let's look at the rate for prime working years. Below is a graph of the labor participation rate for those between the ages of 25 to 54. The rate is 80.8%, a value not seen since November 1984, discounting times past the great recession when the American work experience collapsed.
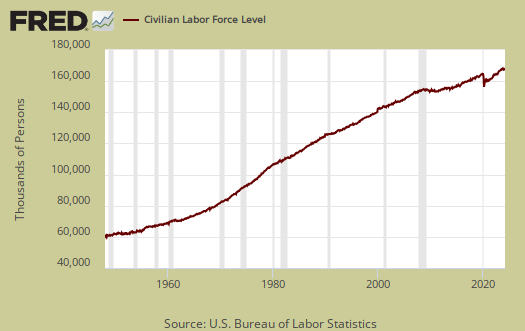
The civilian labor force, which consists of the employed and the officially unemployed, decreased by -432 thousand this month. The civilian labor force has grown by 1,337,000 over the past year. This is another head shaking figure. New workers enter the labor force every day from increased population inside the United States and immigration, both legal and illegal. So the decline here implies people are dropping out of the labor force as well.
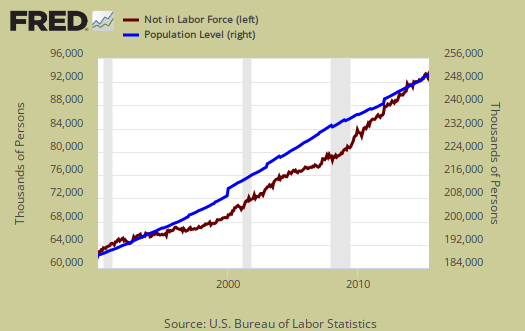
In spite of wild statistical swings, those not in the labor force often grows faster than the population which has the potential to work. Below is a graph of those not in the labor force, (maroon, scale on the left), against the noninstitutional civilian population (blue, scale on the right). Notice how those not in the labor force crosses the noninstitutional civilian population in growth and the accelerated growth started happening right in 2008. The increase cannot be explained by retiring baby boomers alone.
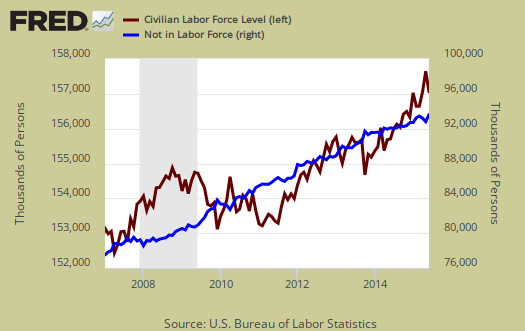
Below is a graph of the civilian labor force, or the official employed plus unemployed, in maroon, scale on left, against those not in the labor force, in blue, scale on right. Notice how those not in the labor force as a trend exceeded those considered employed and unemployed starting around mid 2009. The never ending growing segment of the population that is considered neither employed or unemployed, is above the trend line of those who would be naturally dropping out, such as the retired and those in school. Not in the labor force figures do include retirees and the size of the population greater than age 65 has grown.
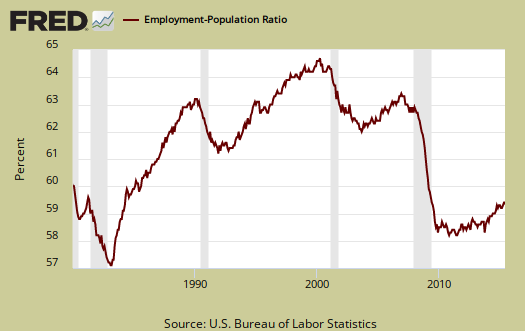
Those considered employed as a ratio to the total Civilian noninstitutional population now stands at 59.3%. The relationship between the employment-population ratio and the labor participation rate (LPR) is: employment-population ratio = LPR * (1 - unemployment rate).
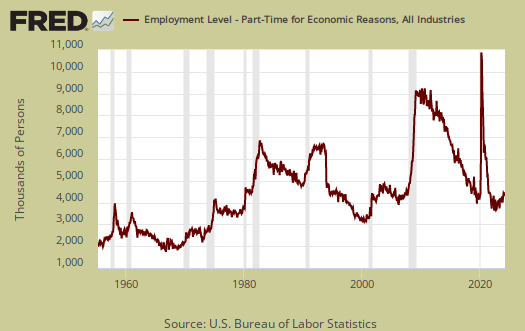
Part-time for economic reasons dropped -147 thousand for the month. Those forced into part time work stands at 6,505,000 people. While dropping almost a million from a year ago this figure remains high. There are still millions of people who need full-time jobs with benefits who simply can't get them. This month's decrease is a good sign.
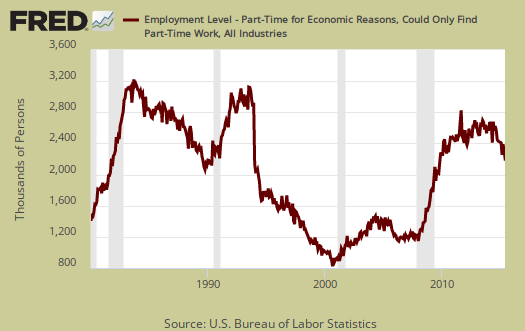
There are two categories of those forced into part-time jobs due to economic circumstances. Those who could only get part-time jobs and those already working who got their hours cut due to businesses not having enough work for them. The number of people who could only get part-time work decreased by -174 thousand to 2,216,000 as shown below.
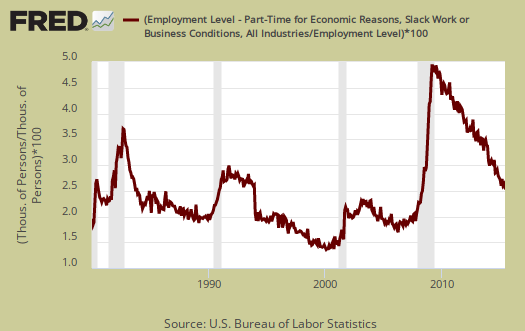
People can also work part-time hours due to slack business demand. People who got their hours cut due to slack working conditions increased by 24,000 and stands at 3,915,000. Below is a graph of forced into part-time work because they got their hours cut, as a percentage of the total employed. This is a recession economic indicator, notice how the line slope matches strongly the graph gray recession bars in the below graph.
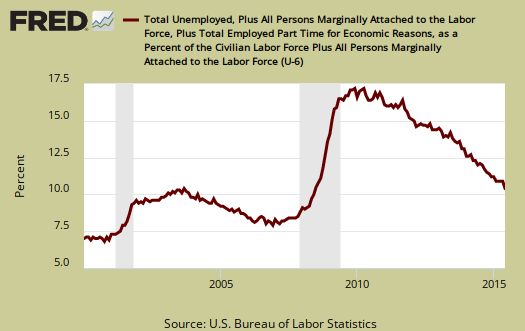
U-6 now stands at 10.5%. U-6 is a broader measure of unemployment and includes the official unemployed, people working part-time hours because that's all they can get and a subgroup not counted in the labor force but are available for work and looked in the last 12 months. The U-6 rate still leaves out some people wanting a job who are not considered part of the labor force, so while it is called an alternative rate, it's almost deceptive in ignoring those long term hopeless and desperate.
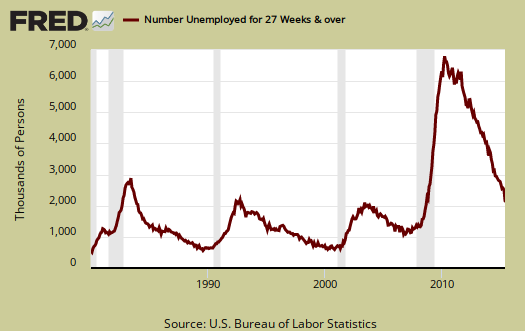
The long term unemployed, or those unemployed for 27 weeks and over, dropped by -381,000 to stand at 2,121,000 people. From a year ago the long term unemployed ranks has declined 31%. The rapid decline without a corresponding increase in employed strongly implies these people are now dropping out of the count. Seems the great recession's long term employment solution is to simply sweep many people under the rug and forget about them.
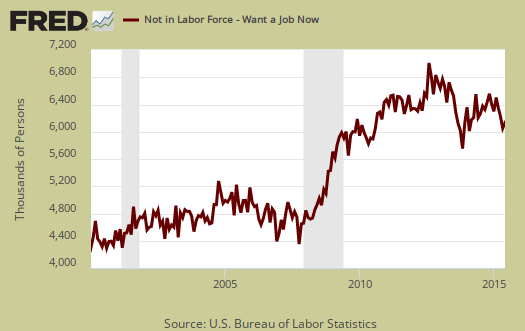
Within the CPS survey is how many people who are considered not in the labor force who report they want a job now. It is a direct survey question. The Census asks people who are not being counted in the unemployment statistics and official unemployment rate if they want a job. The number who answer yes currently stands at 6,076,000, a very large number of people. Those who are not counted yet report they want a job includes the discouraged workers and marginally attached and is seasonally adjusted. This figure has barely budged from a year ago, only a -1.1% decrease. For the month, those not in the labor force stating they want a job increased by 18,000. This figure should drop along with the unemployment rate, which it clearly isn't.
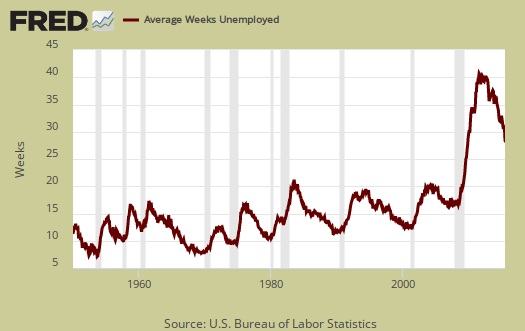
The average length of unemployment is 28.1 weeks and a year ago was 33.3 weeks. Even with a 5.2 week drop from a year ago, over 28 weeks is still a very long time to be without a paycheck. Also the average time to be unemployed is so out of line with the median due to the long term unemployed and as the long term unemployed drop out of the labor force without work, this figure drops.
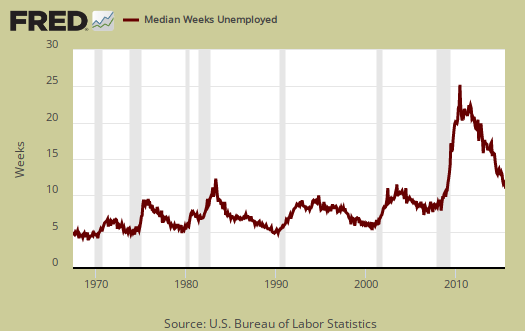
The median time one is unemployed, which means 50% of people have gotten a job in this amount of time is 11.3 weeks. A year ago the median time to be unemployed was 13.2 weeks. Notice how both the average and median still diverge dramatically.
Overall this report is just a mind blowing disaster. Instead of really utilizing America's workforce, in 2015 it appears people are simply being discarded like used tissue. We're sick of seeing these kinds of statistics and would love to see a real labor recovery in America instead.
The BLS commissioner's statement noted the unusual low net labor force gain (1.3 million), yet labor force is employed and unemployed. The not seasonally adjusted not in the labor force gain was 1.6 million for the same time period. Additionally, we've seen repeated not in the labor force gains of over half a million, so this month is not that unusual these days. Below is the BLS commissioner's cautionary statement:
The civilian labor force declined by 432,000 in June (on a seasonally adjusted basis), after increasing by 397,000 in May. At this time of year, a large number of people move into and out of employment and unemployment. On a not seasonally adjusted basis, the net labor force gain in June was unusually low compared with prior years. As always, we caution against placing too much emphasis on one month's data.
Here are our past overviews CPS unemployment statistics, only graphs revised.
I checked: It wasn't Boomers or the Disabled
This wasn’t because of people on Social Security disability, because we actually had a net decrease since last month:
April 2015 -- 8,939,419
May 2015 --- 8,939,029
-390 (less)
SOURCE:
http://www.ssa.gov/oact/STATS/dibStat.html
And it wasn't because of retiring Baby Boomers either:
Apr 2015 --- 39,432,426
May 2015 -- 39,505,145
+72,719
SOURCE:
http://www.ssa.gov/oact/ProgData/icp.html
those are different surveys
you cannot mix these two surveys, it's statistical caca to do that. This is on a month to month basis, to compare two different surveys, databases, one has to compare raw data, not seasonally adjusted, for years to see if there is any correlation and to answer why there is not for the same data.
SSA and Census on wages widely differ and there is little attempt to quantify the differences.