
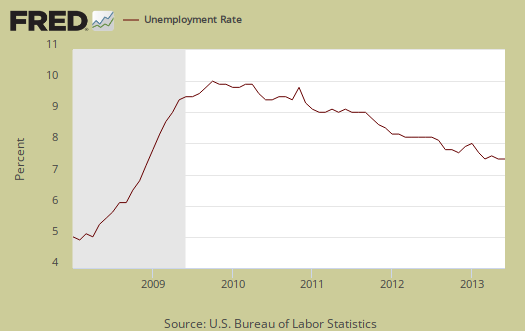
The BLS employment report shows the official unemployment rate remained a static 7.6% and the current population survey unemployment figures are an unmoving pool of little changed this month. More people were employed, yet the number of people stuck in part-time jobs ballooned from last month and the number of unemployed also increased slightly. Both the labor participation rate and the employment to population ratio ticked up a tenth of a percentage point. U-6, a broader measure of unemployment, jumped up half a percentage point to 14.3%. Overall the CPS statistics are stuck in neutral so far in 2013. This article overviews and graphs the statistics from the Current Population Survey of the employment report.
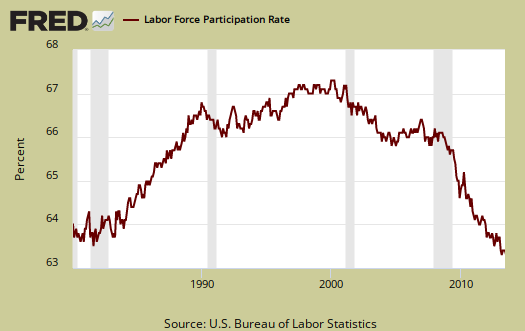
The labor participation rate is now 63.5%, mentioned above. The labor participation rate has declined -0.3 percentage points from a year ago. This implies that those who were dropped from the labor force are mostly staying out of the labor force. For those claiming the low labor participation rate is just people retired, we proved that false by analyzing labor participation rates by age.
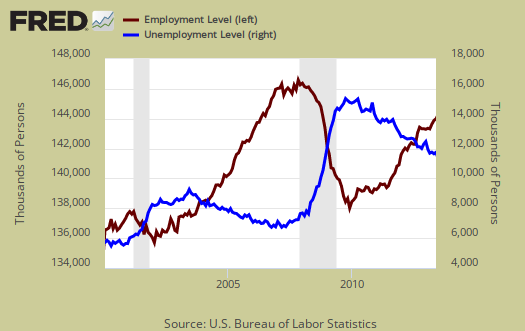
The number of employed people now numbers 144,058,000, a 160,000 monthly increase. We describe here why you shouldn't use the CPS figures on a month to month basis to determine actual job growth. These are people employed, not actual jobs. In terms of labor flows, those employed has increased 1.61 million from a year ago. The noninstitutional population has also increased by 2.397 million during the same time period, so this is a paltry net gain of people employed in some capacity. The statistics from the CPS do generally vary widely from month to month, yet less than 2 million more employed per annum is simply not enough to correct the jobs crisis in America. Below is a graph of the Current Population Survey employed.

Those unemployed stands at 11,777,000, an increase of 17,000 from last month. From a year ago the unemployed has declined by -934,000. This again is a terrible showing and in part explains the static unemployment rate. Bear in mind people enter the labor force for the first time and the United States counts foreign guest workers in their employment statistics. This means many people simply fell off of the BLS radar screen for being counted at all and are considered instead not in the labor force. Below is the change in unemployed and as we can see, this number also swings wildly on a month to month basis.
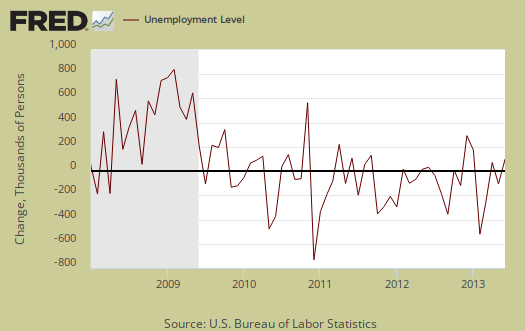
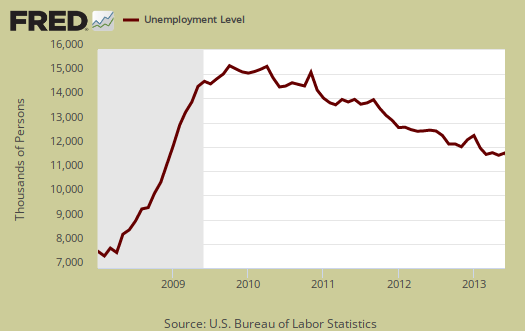
The number of people counted as unemployed has also remained fairly static for years now. In terms of labor flows we don't see much slope, or change in the number of unemployed. Below is a graph of the unemployed.
Below is a graph of those considered employed, in maroon, scale on left, against those considered unemployed, in blue, scale on right, by the BLS methods. It is only recently that the growth rate of the employed has exceeded the growth rate of the unemployed (the maroon line exceeding the blue line).
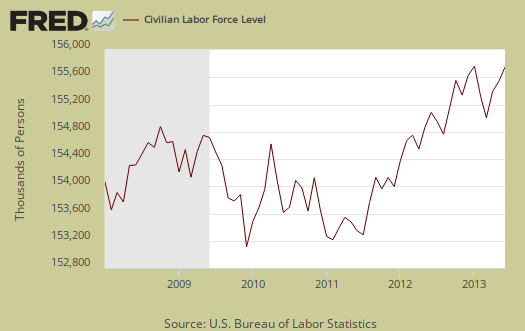
The civilian labor force, which consists of the employed and the officially unemployed, is now at 155,835,000. This is an increase of 177 thousand from last month, mainly due to labor force newly employed, as re-entrants declined by -42 thousand and job leavers also declined by -28 thousand, Those who left their jobs increased by 82 thousand. Notice in the graph below how many more people are in the labor force than at the start of the 2008 recession. Population increases every month and this post gives details on that increase, while this one describes BLS labor concepts as well as how many jobs are needed just to keep up with the increased population.
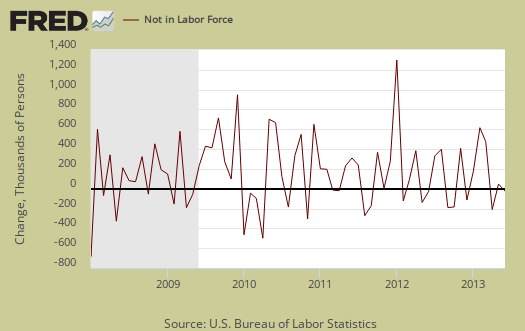
It's fairly clear the American workforce is ending up in the not counted statistics overall, yet for this month, those not in the labor force now tallies to 89,717,000, an increase of 12,000 from last month, so pretty much no change. From a year ago, those considered not in the labor force has grown by 1.71 million. Below is the change to show on a month to month basis, the CPS shows quite a bit of variance. We talk about the wild monthly CPS changes in this post.
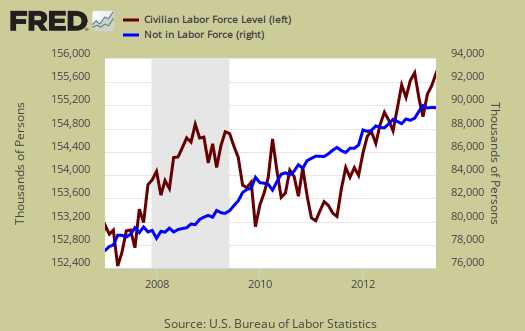
Below is a graph of the civilian labor force, in maroon, scale on left, against those not in the labor force, in blue, scale on right. Notice how those not in the labor force as a trend exceeded those considered employed and unemployed since 2008. It is only recently, in the past couple of months, where we see the reverse by trend lines, which is a good thing. What we have seen is a never ending growing segment of the population that is considered neither employed or unemployed, i.e. not in the labor force, increasing, above the trend line of those who would be naturally dropping out, such as the retired and those in school. Not in the labor force figures do include retirees.
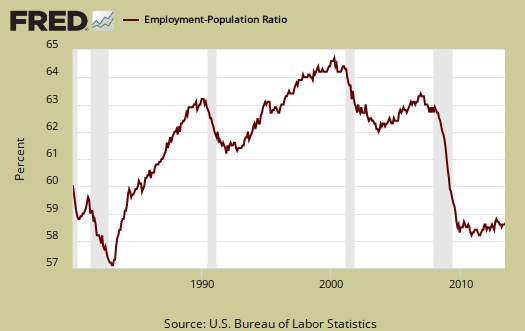
Those considered employed as a ratio to the total Civilian noninstitutional population stands at 58.7%, which is a 0.1 percentage point increase from last month. This ratio hasn't been hovering around 1983 record lows for years now. The low ratio implies there are many people who could be part of the labor force who are not anymore, as shown in the graph below.
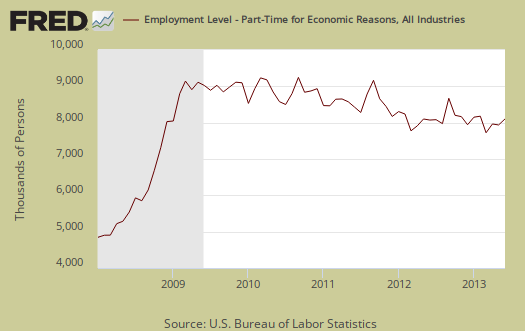
A huge problem with today's labor market is the gross number of working part-time generally. There are a huge number of people who need full-time jobs with benefits who can't get decent career oriented positions. Those forced into part time work is now 8,226,000, an increase of 322,000 from last month. Those stuck in part-time has increased 16,000 from a year ago, not a good sign of the labor market. This is a hell of a lot of people stuck with part-time hours who need full-time work. Of those considered employed, a whopping 27,270,000 of them are in part-time jobs, for whatever reason. That's 18.9% of people employed are in part-time jobs, a very high ratio.
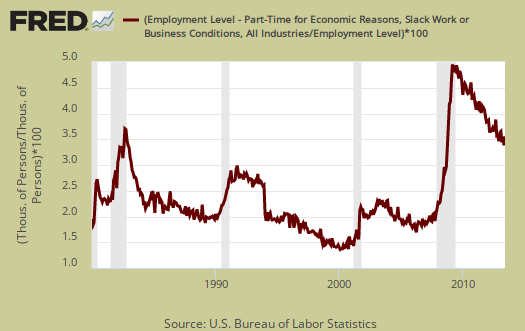
Below is a graph of forced into part-time work because they got their hours cut, graphed as a percentage of the total employed. Part-time due to cut hours is known as slack work conditions and consisted of 5,193,000 people. This is an increase of 352,000 from last month and accounts for more than the total of people stuck in part-time hours who need full time. Below is a graph of forced part-timers due to slack work conditions as a percentage of the civilian labor force. We think this graph is a recession economic indicator, and notice the slope matches strongly the gray recession bars of the graph. The percentage of people in working part-time due to slack economic conditions has stayed extremely high since the start of the Great Recession, as a trend.
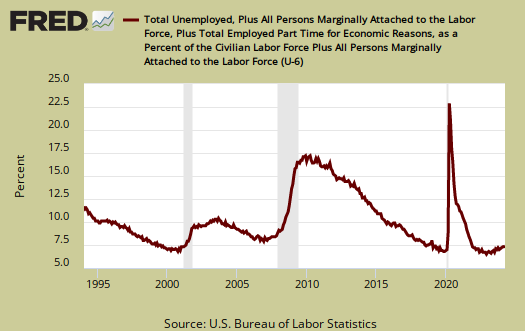
U-6 is a broader measure of unemployment and includes the official unemployed, people working part-time hours because that's all they can get and a subgroup not counted in the labor force but are available for work and looked in the last 12 months. Believe this or not, the U-6 alternative unemployment rate still leaves out some people wanting a job who are not considered part of the labor force. U-6 increased 0.5 percentage points to 14.3%. The reason for the increase in U-6 is the increase in those marginally attached to the labor force and the jump in those stuck with part-time work.
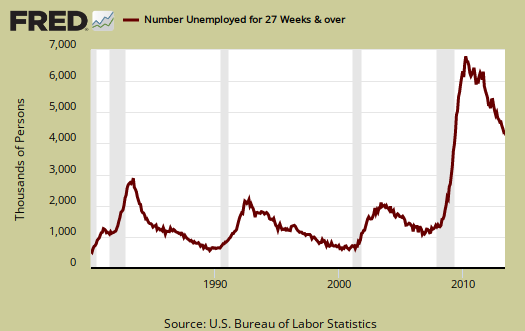
The long term unemployed, or those unemployed for 27 weeks and over, stand at 4,328,000 people. This is a decrease of -29,000 from last month. The long term unemployed are the crisis of our time and this figure decrease does not necessarily imply those unemployed for a long time are actually finding jobs. The long term unemployed are now 36.7% of the total unemployed and this percentage decreased -0.6 percentage points from last month.
The marginally attached are people not in the labor force because they have not looked for a job in the last month, but have looked for a job in the last year. This number has ballooned since 2007 and not returned to pre-recession levels. The graph below is the number of people considered marginally attached to the labor force, currently at 2.582 million. This is an increase of 99,000 from a year ago. In other words, the marginally attached figures just are not dropping as ithey should.
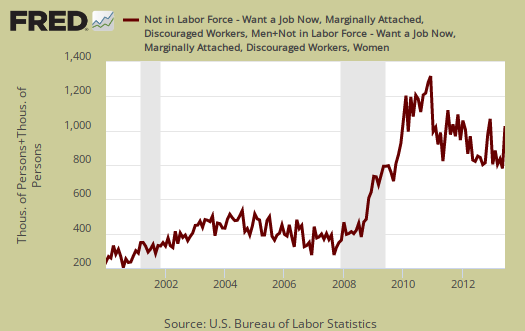
Discouraged workers are people, not counted as part of the civilian labor force, who not only want a job, but also looked for one in the last year. These people aren't job hunting now because they believe there are no jobs out there. Below is the graph of discouraged workers, currently at 1,027,000 people and are a subset of the marginally attached. Discouraged workers is kind of a barometer for how the job market is perceived. This is an increase of 206,000 people from a year ago.
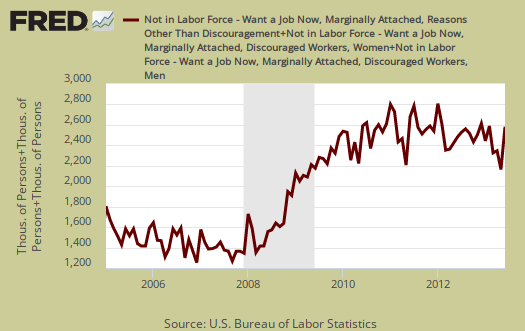
One of our favorite statistics from the CPS survey is how many people who are considered not in the labor force, want a job now. It is a direct survey question from the CPS. The survey asks people who are not being counted in the unemployment statistics and official unemployment rate if they want a job. The number who answer yes currently stands at 6,580,000. A year ago this figure was 6,556,000. In other words, not much has changed and there are an astounding number of people not counted who report they actually want a job and roughly 2.2 million higher than before the recession. This figure includes the discouraged workers and marginally attached, but is seasonally adjusted, unlike the above.

The average length of unemployment is now 35.6 weeks, a decline of 1.3 weeks from last month, a surprising sign. This still is an absurdly long amount of time to be unemployed and has stayed highly elevated for years. The average duration is also so high due to the long-term unemployed. Many face age discrimination as well as discrimination for the fact they need a job.
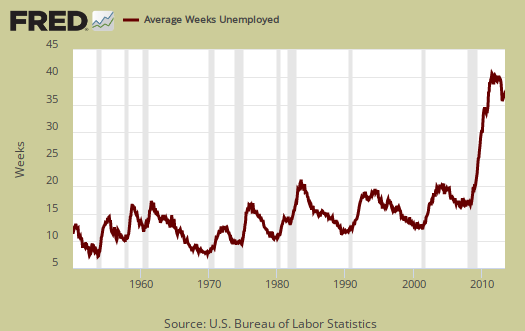
The median time one is unemployed, which means 50% of people have gotten a job in this amount of time, and is 16.3 weeks, a decrease of a week from last month. Both the average and median duration declines can be attributed to the decrease in those unemployed long term.

Those unemployed less than five weeks decreased by -14 thousand, those unemployed between five weeks and 14 weeks increased by 195 thousand and people who had been unemployed for 14 weeks to 26 weeks decreased by -54,000. As previously noted, the long term unemployed decreased by -29 thousand. . A drop in the unemployed does not necessarily mean they found a job.
Here is our overview of last month's CPS unemployment statistics.
Job creation and Population Growth
According to the National Center for Educational Statistics (www.nces.ed.gov) America's schools and colleges have a record number of students attending school as the population has continued to increase and enrollment rates have also continued to exponentially rise --- 3.4 million high school graduates this year alone --- but there weren't 3.4 million net jobs created for them. Job creation has not been keeping up with natural population growth. Then add in the work visas, cut hours, the escalation of TEMP jobs, the continued offshoring and further downsizing...and we have a national unemployment crisis not seen since the Great Depression. But because the DOW JONES is breaking all-time records, everybody thinks the economy is improving.
There are way more college graduates than jobs, STEM 2
Bud, login! You're posting anonymous comments whereas if you are logged in you can track your comments and replies via your account.
Yes, it's true, there are way more college graduates than jobs. There are almost double the number of STEM graduates than jobs. Basically as it is, they import more H-1B Visa foreign workers than jobs created. This is before the Comprehensive immigration reform disaster.
margin of error
the household survey is extrapolated from a survey of just 60,000 households & has a large margin of error; the 90% confidence interval for the monthly change in unemployment is roughly +/- 300,000, and for the change in the unemployment rate it's +/- 0.2 percentage points...this means that when BLS reports that the unemployment rate for June was 7.6%, it means that there's a one in ten chance that it's either less than 7.4% or greater than 7.8%; obviously, that's not something you want to base your monetary policy on...
rjs
CPS, significant change, 400,000
You're right, it is 90% confidence level of +-300,000 but the statistically significant change margin is 400,000.
LOL, I think the Fed is not just basing buying up MBSes on the official unemployment rate, but also the labor participation rate and a few other figures from the employment statistics.
Notice people thinking the "housing boom" will crash when the Fed stops buying up mortgage backed securities?