
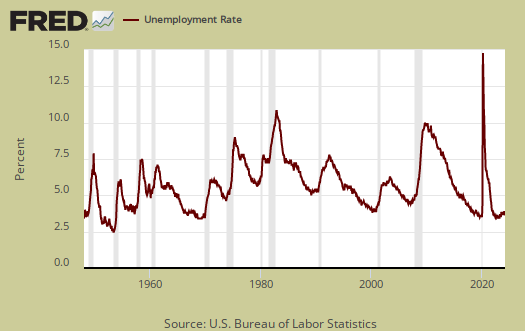
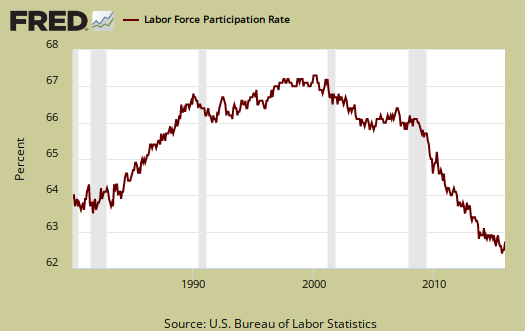
The December unemployment report seems like nothing but good news. The official unemployment rate did not change and is 5.0%. The ranks of employed swelled and those not in the labor force shrank. The labor participate rate ticked up a tenth of a percentage point to stand at a still very low 62.6%. Overall, this month's CPS report belies some of the other ominous economic news.
This article overviews and graphs the statistics from the Employment report Household Survey also known as CPS, or current population survey. The CPS survey tells us about people employed, not employed, looking for work and not counted at all. The household survey has large swings on a monthly basis as well as a large margin of sampling error. This part of the employment report is not about actual jobs gained but people and their labor status.
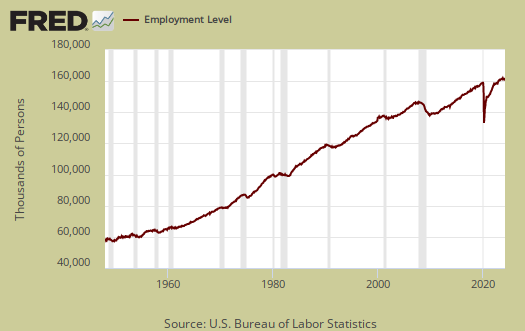
Those employed soared by 485,000 this month and stands at 149,929,000. From a year ago, the ranks of the employed has increased by 2.49 million. The annual gain jumped up by half a million from last month's annual figure.
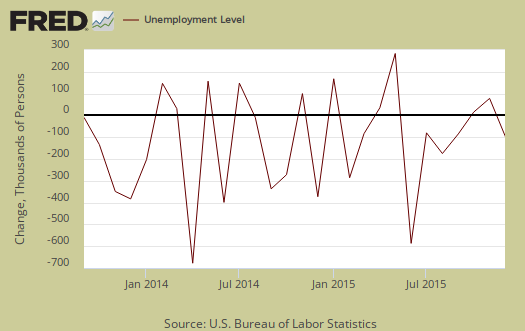
Those unemployed decreased by -20,000 to stand at 7,904,000. From a year ago the unemployed has decreased by -800 thousand. Below is the month change in unemployed which typically has wild swings from month to month.
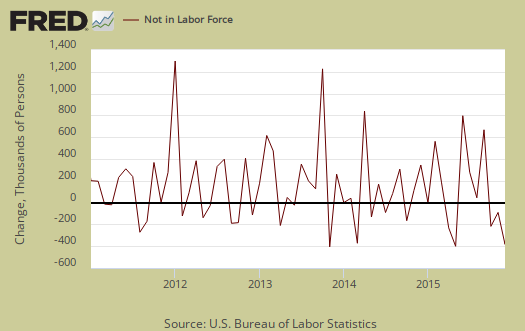
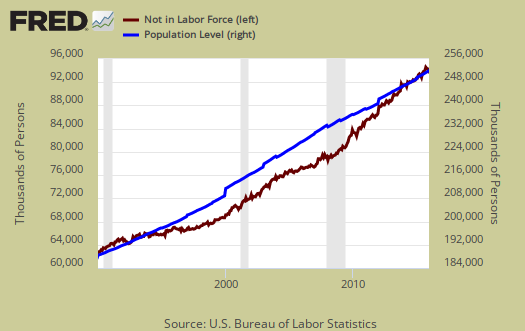
Those not in the labor force decreased for the third consecutive month, this time by -277,000 to 94.103 million. The below graph is the monthly change of the not in the labor force ranks. Those not in the labor force has increased by 1,218,000 in the past year and this annual gain has been halved in recent months.
The labor participation rate ticked up another 0.1 percentage points to 62.6%, While still in 1980's lows, upward movement is a very good sign.
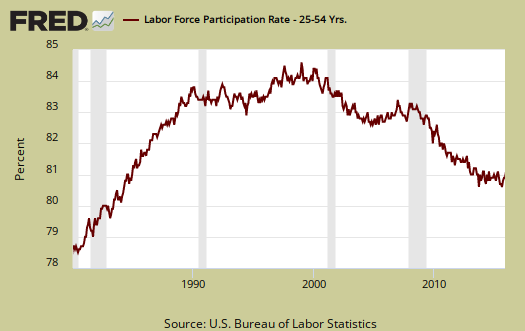
Below is a graph of the labor participation rate for those between the ages of 25 to 54. The rate is 80.9%, which is a 0.1 percentage point increase from last month. These are the prime working years where one should not see record low participation rates. While the increase is a trend, this participation rate is still at March levels, a long way to go to return to 83% 2007 levels.
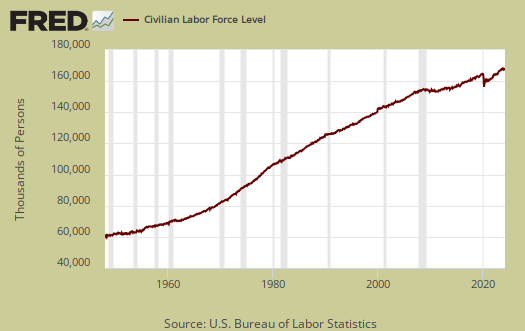
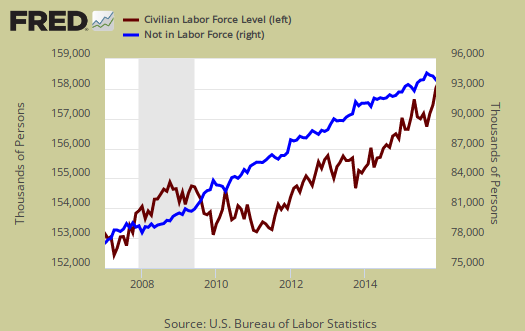
The civilian labor force, which consists of the employed and the officially unemployed, increased by 466 thousand this month and was the 2nd consecutive month increase. The civilian labor force has grown by 1,691,000 over the past year. New workers enter the labor force every day from increased population inside the United States and immigration, both legal and illegal. Those not in the labor force has grown less than the civilian labor force, a revision from trends earlier in the year.
Those not in the labor force now grows less the population which has the potential to work, a very recent trend reversal. Below is a graph of those not in the labor force, (maroon, scale on the left), against the noninstitutional civilian population (blue, scale on the right). &n bsp; Notice how those not in the labor force crisscrosses the noninstitutional civilian population in growth and the accelerated growth started happening in 2008.
Below is a graph of the civilian labor force, or the official employed plus unemployed, in maroon, scale on left, against those not in the labor force, in blue, scale on right. See how those not in the labor force as a trend exceeded those considered employed and unemployed starting around mid 2009. Starting in 2014 it has reverted back, yet look at how is it reverted once again in 2015 and now swinging back. This shows those not in the labor force has been growing much faster than those obtaining jobs and being counted as looking for work. Those not in the labor force does include retirees and students.
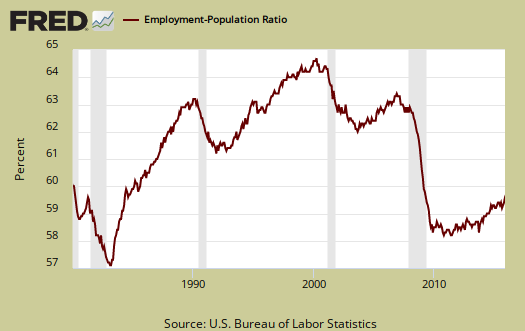
Those considered employed as a ratio to the total Civilian noninstitutional population now stands at 59.5%, which is a 0.1 percentage point increase from last month. The relationship between the employment-population ratio and the labor participation rate (LPR) is: employment-population ratio = LPR * (1 - unemployment rate).
Those forced into part-time work due to the economy decreased this month by -63 thousand. Those forced into part time work for economic reasons stands at 6,022,000 people. The annual decrease is now -764 thousand.
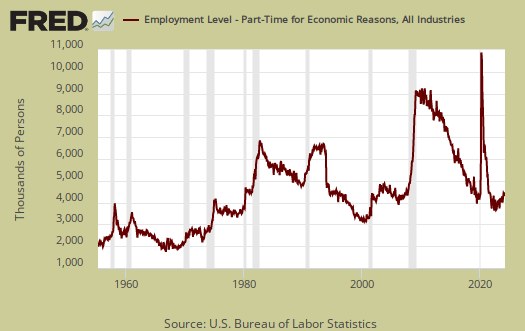
There are two categories of those forced into part-time jobs due to economic circumstances. Those who could only get part-time jobs and those already working who got their hours cut due to businesses not having enough work for them. The number of people who could only get part-time work decreased by -49,000 as shown below.

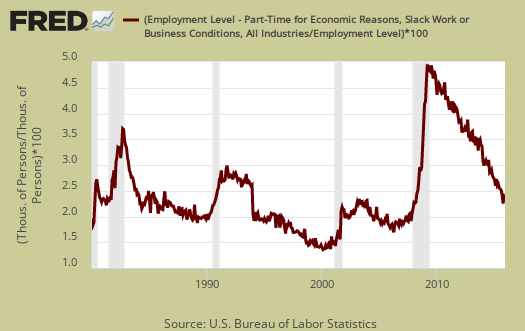
People can also work part-time hours due to slack business demand. People who got their hours cut due to slack working conditions increased by 12,000 and stands at 3,548,000. Below is a graph of forced into part-time work because they got their hours cut, as a percentage of the total employed. This is a recession economic indicator and has decreased by -485 thousand from last year.
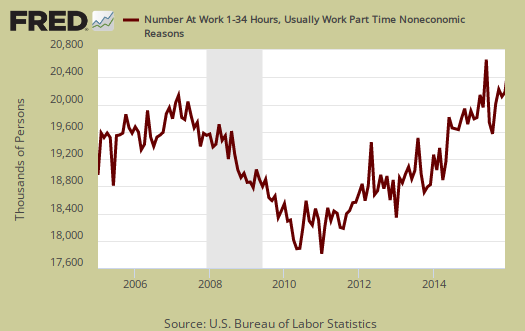
Part-time workers who are voluntarily working part-time jobs increased by 72,000 to stand at 20,243,000. This just is so high, it's shocking.
U-6 now stands at 9.9% and this is no change from last month. U-6 is a broader measure of unemployment and includes the official unemployed, people working part-time hours because that's all they can get and a subgroup not counted in the labor force but are available for work and looked in the last 12 months. The U-6 rate still leaves out some people wanting a job who are not considered part of the labor force, so while it is called an alternative rate, but it still ignores many who should be counted as unemployed.

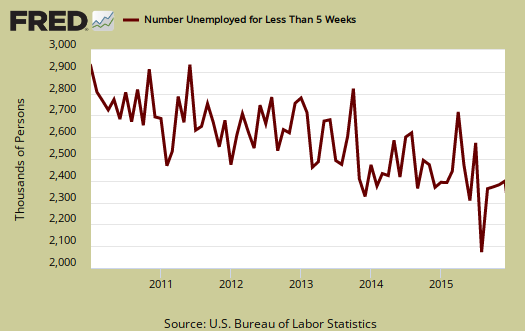
The newly unemployed increased by 11.000 and those unemployed for less than five weeks decreased by seven thousand to stand at 2,405,000. Below is a graph of those unemployed for less than five weeks.
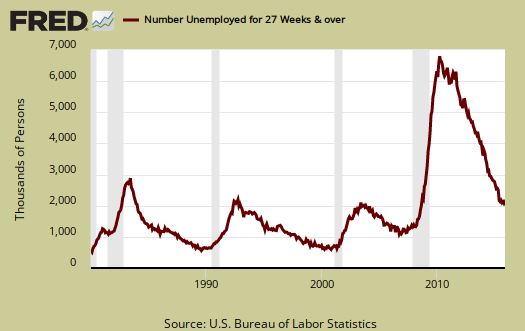
The long term unemployed, or those unemployed for 27 weeks and over, increased by 31 thousand to 2,085,000 people. From a year ago the long term unemployed ranks has declined by -687,000.
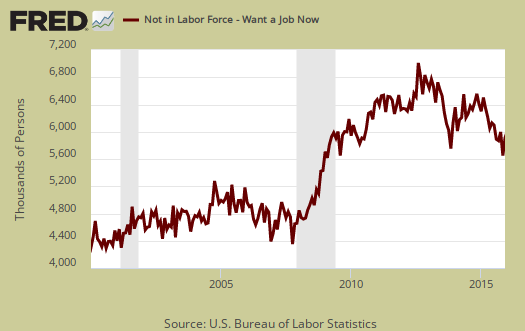
Within the CPS survey is how many people who are considered not in the labor force who report they want a job now. It is a direct survey question. The Census asks people who are not being counted in the unemployment statistics and official unemployment rate if they want a job. The number who answer yes currently stands at 5,886,000, and increased by 249 thousand from last month. Those who are not counted yet report they want a job includes the discouraged workers and marginally attached and is seasonally adjusted. This figure has decreased by -521 thousand from a year ago. This is actually a not a great sign from this report.
The average length of unemployment is 27.6 weeks and a year ago was 32.5 weeks. This is a decline of 0.3 weeks from last month The average time to be unemployed has stayed completely out of line with the median duration.

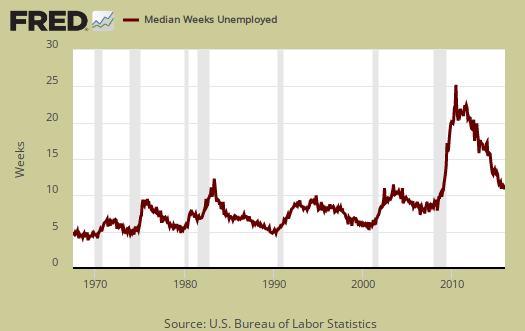
The median time one is unemployed, which means 50% of people have gotten a job in this amount of time is 10.5 weeks and decreased by -0.2 weeks from last month. A year ago the median time to be unemployed was 12.6 weeks and this figure has been steadily decreasing.
This month's CPS report is a seemingly solid sign of improving conditions and labor stability. The increase in those not in the labor force wanting a job and that figure not shrinking much is a bad sign that stands out. Next month are the CPS population controls and thus major revisions, which may change our rosy picture into not so much of a bloom. Also, employment often follows other bad economic news so a few good reports doesn't negative the terrible economic data pouring in Here are our past overviews CPS unemployment statistics, only graphs revised.
4th quarter could be negative...
not often you see GDP fading with such good jobs numbers, but every report i reviewed this week appears to subtract from 4th quarter GDP...ive posted my estimates on construction and the trade deficit here already; both wholesale and factory inventories came in 0.3% lower despite just a 0.1% drop to finished goods prices...a drop in growth of inventories could take a 100 basis points off of GDP growth which already looks to have a fairly weak PCE component...the Atlanta Fed puts the 4th quarter growth at an 0.8% rate; this is the first time i've ever thought they might be too high..
rjs
Q4 negative possibly
I haven't spent the time needed to calculate out monthly reports to give a guesstimate but inventories contracting everywhere is not a good sign. As I recall PCE seems to be around the same pace as Q3 so far.
PCE
November PCE was decent enough, up 0.3% with almost no inflation adjustment...but October was a gooseegg with a 0.1% deflator...if December could duplicate November, the 4th quarter is out of the woods, but if December PCE is weak, 4th quarter GDP is at risk from weakness in investment and net exports...
rjs