
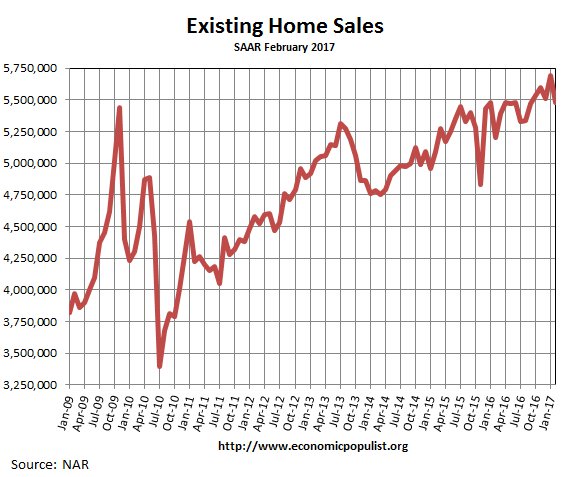
NAR's February existing home sales dropped 3.7% from January. Sales were 5.48 million, whereas January had 5.69 million annualized sales. Sales are still a soaring 5.4% higher than a year ago. Prices are through the roof and inventories are now absurdly tight. Affordability and availability are cited as the main reasons for the drop in sales as actual foot traffic looking at properties has increased.
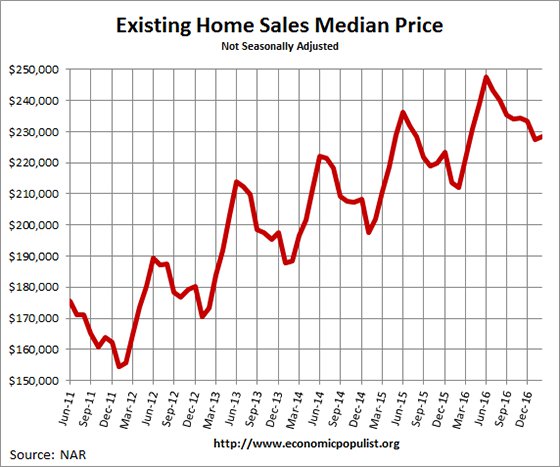
The national median existing home sales price, all types, is $228,400, a 7.7% increase from a year ago. January's jump in median price was 8.1% and February makes it 60 months in a row that prices have soared. The average existing sales price for homes in February was $270,100, a 5.8% increase from a year ago. Below is a graph of the median price.
Cheaper homes have simply dried up as noted by NAR:
Lawrence Yun, NAR chief economist, says closings retreated in February as too few properties for sale and weakening affordability conditions stifled buyers in most of the country. "Realtors® are reporting stronger foot traffic from a year ago, but low supply in the affordable price range continues to be the pest that's pushing up price growth and pressuring the budgets of prospective buyers," he said. "Newly listed properties are being snatched up quickly so far this year and leaving behind minimal choices for buyers trying to reach the market."
Distressed home sales were 7% of all sales and the third month in a row for such low pickings. Distressed sales were 10% of all sales a year ago. Foreclosures were 6% while short sales were 1% of all sales. The discount breakdown was 18% for foreclosures and short sales were a 17% price break.
First time home buyers were 32% of the sales. First time home buyers were 30% of all sales a year ago. Investors were 17% of all sales and 71% of these investors paid cash. All cash buyers were 27% of all sales. This is the highest percentage of all cash buyers since November 2015. A year ago all cash buyers were 25% of all existing home sales. The NAR released a report in 2016 that described buyer and sellers and there first time home buyers were 35%. Once again first time home buyers are historically suffering:
The affordability constraints holding back renters from buying is a signal to many investors that rental demand will remain solid for the foreseeable future. Investors are still making up an above average share of the market right now despite steadily rising home prices and few distressed properties on the market, and their financial wherewithal to pay in cash gives them a leg-up on the competition against first-time buyers.
The median time for a home to be on the market was 45 days and 42% of all homes sold took less than a month to sell. Short sales by themselves took 214 days, foreclosures in 49 days and non-distressed homes also took 45 days. Housing inventory from a year ago has decreased -6.4% but is up 4.2% from the previous month. Current the 1.75 million homes available for sale are a 3.8 months supply. In January the unsold inventory supply was at 3.5 months. That is an incredibly tight housing market and it is clear houses are being snatched up as soon as they are listed.
The west has the most unaffordable housing consistently, and many places on the west coast have the shortest times for houses to be on the market.
Inventory data from realtor.com® reveals that the metropolitan statistical areas where listings stayed on the market the shortest amount of time in February were San Jose-Sunnyvale-Santa Clara, Calif., 23 days; San Francisco-Oakland-Hayward, Calif., 27 days; Vallejo-Fairfield, Calif., 33 days; Seattle-Tacoma-Bellevue, Wash., 36 days; and Boulder, Colo., at 37 days.
Below is NAR's breakdown by existing home sales type and regions. Seemingly only millionaires can afford to have shelter in the West, look at that median home price!
February existing-home sales in the Northeast slumped 13.8 percent to an annual rate of 690,000, but are still 1.5 percent above a year ago. The median price in the Northeast was $250,200, which is 4.1 percent above February 2016. In the Midwest, existing-home sales fell 7.0 percent to an annual rate of 1.20 million in February, but are still 2.6 percent above a year ago. The median price in the Midwest was $171,700, up 6.1 percent from a year ago. Existing-home sales in the South in February rose 1.3 percent to an annual rate of 2.34 million, and are now 5.9 percent above February 2016. The median price in the South was $205,300, up 9.6 percent from a year ago. Existing-home sales in the West decreased 3.1 percent to an annual rate of 1.25 million in February, but are 9.6 percent above a year ago. The median price in the West was $339,900, up 9.6 percent from February 2016..
Here are our past overviews of existing home sales not revised.
Recent comments