
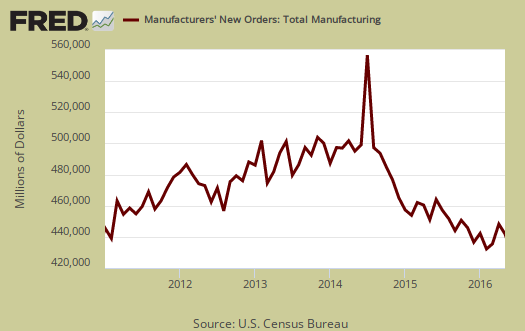
The Manufacturers' Shipments, Inventories, and Orders report shows factory new orders declined by -1.0% for May. That's after April new orders increased 1.8%. Durable goods new orders by themselves dropped by -2.3% for May after an April 3.2% icnrease. Transportation new orders plunged by -5.7%. The year to date in comparison to the same time period in 2015, new orders are down -1.9% while just durable goods new orders are up 1.6%. Overall things look sluggish at best. The Census manufacturing statistical release is called Factory Orders by the press and covers both durable and non-durable manufacturing orders, shipments and inventories.
While transportation equipment new orders plunged by -5.7% , motor vehicles bodies & parts new orders increased by 0.8%. Volatile aircraft new orders increased 0.8% in nondefense and declined in defense aircraft new orders by -35.3%.
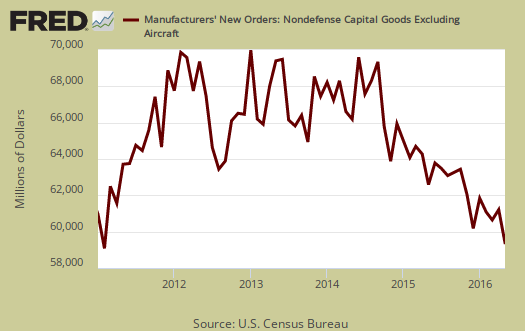
Core capital goods new orders decreased by -0.4%. The previous month showed a -0.9% decrease. Core capital goods are capital or business investment goods and excludes defense and aircraft. This is indicating slower future economic growth.
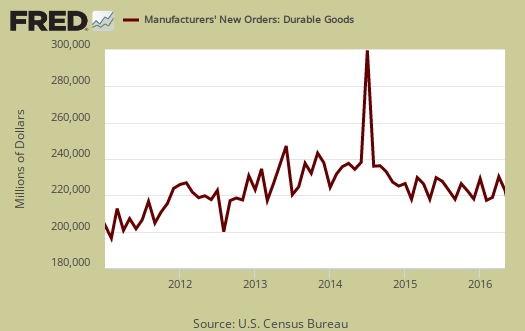
Nondurable goods increased by 0.3%. Manufactured durable goods new orders, decreased -2.3%, shown below.
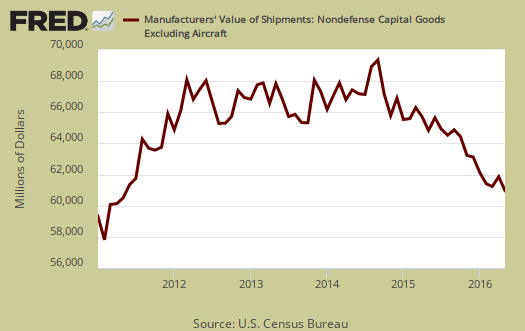
Shipments had no change for the month. Nondurable goods shipments increased 0.3%. Durable goods shipments on the other hand decreased -0.2% as machinery shipments dropped by -0.9% Core capital goods shipments decreased by -0.5%. Core capital goods shipments go into the GDP calculation. Below is a graph of core capital goods shipments.
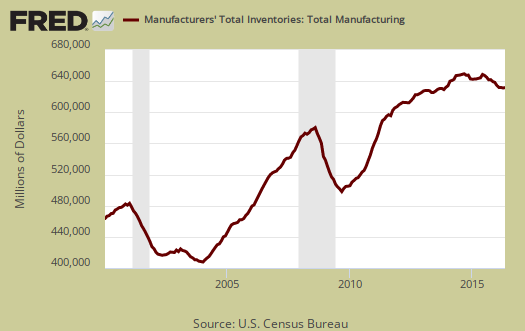
Inventories for manufacturing overall were down slightly by -0.1% . Durable goods inventories decreased by -0.3% while nondurables increased 0.1%.
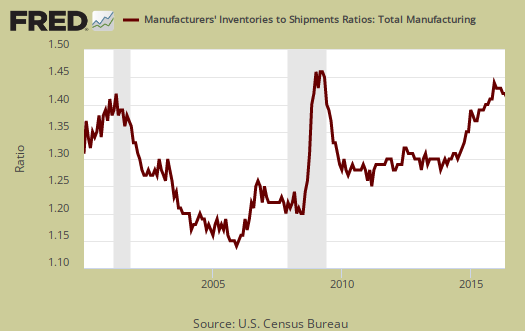
The inventory to shipments ratio was 1.36, the same as April. When ratios increase it can imply economic sluggishness.
Unfilled Orders increased 0.2%. Core capital goods unfilled orders declined by -0.3%. Motor vehicles unfilled orders increased 1.0%. Some in the press are claiming this bit of news erases the bad news of declining new orders. As one can see core capital goods unfilled ordered declined so there is no real silver lining in the unfilled orders percentage increase.
One might notice the trend in the graphs and it all isn't good news for manufacturing. All graphs are showing long term trend declines.
Part of this report goes into calculating GDP. The BEA takes this report, called M3, and uses the shipments values to calculate investment in private equipment, investment in software. Manufacturing inventories also goes into the changes in private inventories GDP calculation. At the bottom of this post is a little more information to estimate part of the GDP investment component.
The St. Louis Federal Reserve FRED graphing system has added individual NAICS data series from this report. If you're looking for a graph of some particular NAICS category, such as light trucks, autos & parts, or machinery, it might be found on FRED. Most news outlets source the Commerce Department, while technically correct, also makes it impossible for you, our beloved detailed reader, to find the actual statistical report and data which you might be focused in on. There is much more detail in the statistical tables published by the Census website for manufacturing statistics.
big hit to Q2 GDP
producer prices for finished goods were up 0.7% in May, following an increase of 0.2% in April, with producer prices for energy goods up 2.8% and core producer prices up 0.3%, so after factory inventories are adjusted for inflation, they will likely show a real decrease on the order of 0.8% for the month, following the 0.3% real decrease in April...thus with two months of factory inventory data in the books, then, it appears that this real inventory contraction will result in a substantial subtraction from 2nd quarter GDP figures when they're released at the end of July...
rjs