
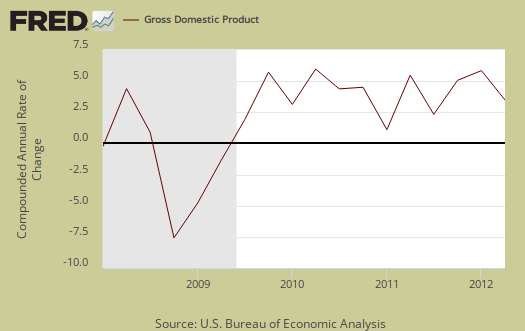
Q2 2012 real GDP showed 1.5% annualized growth. in the advance release. Q1 2012 GDP was revised up, from 1.9% to 2.0%. This article overviews and graphs the BEA statistical release for second quarter gross domestic product.
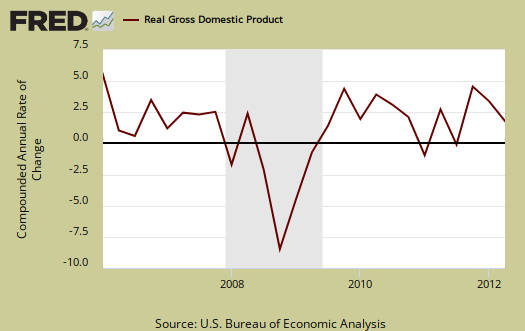
Q2 GDP showed less personal consumption, and a dramatic increase in imports. Our trade deficit is back with a vengeance. Investment added to GDP and States slashed expenditures once again.
As a reminder, GDP is made up of: where Y=GDP, C=Consumption, I=Investment, G=Government Spending, (X-M)=Net Exports, X=Exports, M=Imports*.
The below table shows the percentage point breakdown of the individual components contribution to overall GDP from Q1 2012 to Q2 2012. The difference, or spread, between Q4 and Q1 components is by percentage points, with the new revisions.
| Comparison of Q1 2012 and Q2 2012 GDP Components | |||
|---|---|---|---|
|
Component |
Q1 2012 |
Q2 2012 |
Spread |
| GDP | +1.96 | +1.54 | -0.42 |
| C | +1.72 | +1.05 | -0.67 |
| I | +0.78 | +1.08 | +0.30 |
| G | –0.60 | –0.28 | +0.32 |
| X | +0.60 | +0.73 | +0.13 |
| M | –0.54 | –1.04 | -0.50 |
As we can see in the above GDP breakdown, imports removed over a percentage point of GDP and personal consumption was weak, as estimated earlier.
C, or real personal consumption expenditures contribution to GDP was less than Q1, yet over a percentage point of Q2 GDP. The below graph is the percentage change in PCE from Q1, annualized.
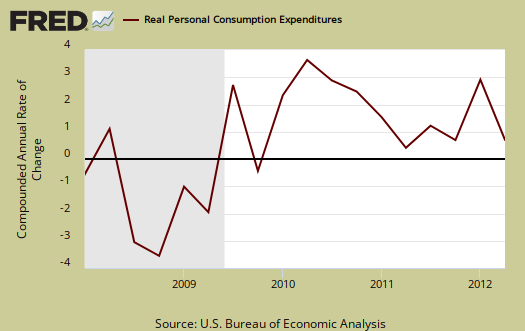
Below is the breakdown in C or real PCE annualized change. The Q2 PCE 1.05 percentage point breakdown was almost all services, or +0.87 percentage points. Goods only added +0.18 percentage points to GDP. Household consumption was most of services, a +0.77 percentage point contribution, with housing and utilities being +0.40 of those +0.77 percentage points and heath care contributing +0.20 percentage points to household consumption. In other words, necessary basic living was most of personal consumption.
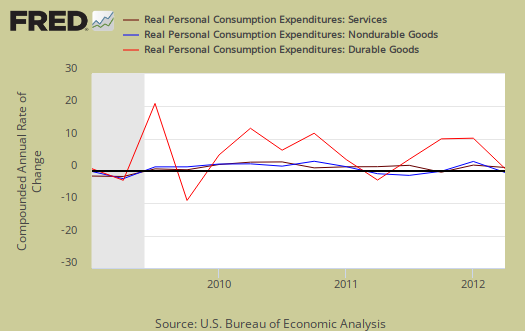
Within PCE (C), goods were mostly gas and energy, or +0.38 percentage points of the total +0.18 percentage points goods contributed to GDP. Durable goods dropped -0.08 with motor vehicles and parts giving a -0.29 percentage point contribution to durable goods. Below is PCE with the quarterly annualized percentage change breakdown of durable goods (red), nondurable goods (blue) versus services (maroon).
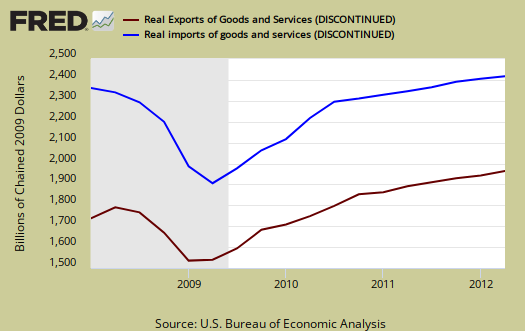
Below are net exports, or the trade deficit, in real chained dollars, by quarter. It's not just volume that can change, the assessed prices, inflation adjustors and exchange rates can. Imports subtract from gross domestic product. The trade deficit subtracted –0.31 percentage points from Q2 GDP. Q1 saw a +0.06 percentage point contribution from net trade.
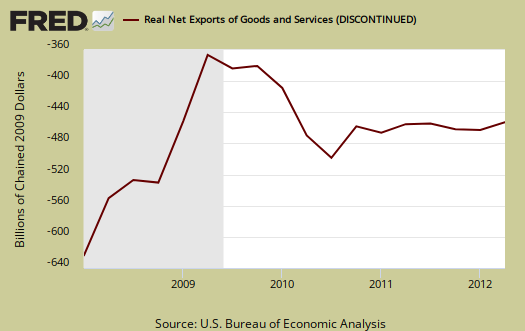
The below graph shows real imports vs. exports and we can see, even when the global economy is slowing down, the U.S. massive trade deficit stunts our economic growth.
Gross domestic purchases are what U.S. consumers bought no matter whether it was made in Ohio or China. It's defined as GDP plus imports and minus exports or using our above equation: where P = Real gross domestic purchases. Real gross domestic purchases was 1.8%, the same as last quarter. Exports are subtracted off because they are outta here, you can't buy 'em, but imports, as well a know all too well, are available for purchase at your local Walmart. When gross domestic purchases exceed GDP, that's actually bad news, it means America is buyin' imports instead of goods made domestically.
Part of investment, changes in private inventories added +0.32 percentage points to GDP. In Q1, changes in private inventories subtracted, or contributed –0.39 percentage points, to GDP growth. We can see the massive shedding of business inventories in 2009 in the below graph. Inventory build up with weak demand is not a good thing for future growth.

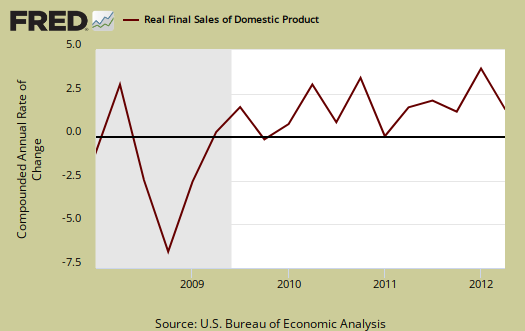
Below are real final sales of domestic product, or GDP - inventories change. This gives a better feel for real demand in the economy. This is because while private inventories represent economic activity, the stuff is sitting on the shelf, it's not demanded or sold. Q2 Real final sales increased 1.2% for Q2, whereas real final sales for Q1 were 2.4%.
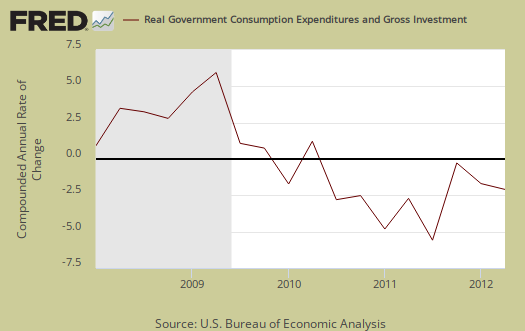
Government consumption and investments do add to U.S. economic growth in spite of the rhetoric one hears. Federal spending subtracted off only –0.03 percentage points while state & local spending cuts resulted in a –0.26 percentage point contribution, the same as Q1. Below is the percentage quarterly change of government spending, adjusted for prices, annualized.
Below are the percentage changes of Q2 2012 GDP components, from Q1. Tthere is a difference between percentage change and percentage point change. Point change adds up to the total GDP percentage change and is reported above. The below is the individual quarterly percentage change, against themselves, of each component which makes up overall GDP. Additionally these changes are seasonally adjusted and reported by the BEA in annualized format.
|
Q2 2012 Component Percentage Change (annualized) |
|||
|---|---|---|---|
| Component | Percentage Change from Q1 | ||
| GDP | +1.5% | ||
| C | +1.5% | ||
| I | +8.5% | ||
| G | –1.4% | ||
| X | +5.3% | ||
| M | +6.0% | ||
The BEA's comparisons in percentage change breakdown of 2nd quarter GDP components are below. Changes to private inventories is a component of I.
C: Real personal consumption expenditures increased 1.5 percent in the second quarter, compared with an increase of 2.4 percent in the first. Durable goods decreased 1.0 percent, in contrast to an increase of 11.5 percent. Nondurable goods increased 1.5 percent, compared with an increase of 1.6 percent. Services increased 1.9 percent, compared with an increase of 1.3 percent.
I: Real nonresidential fixed investment increased 5.3 percent in the second quarter, compared with an increase of 7.5 percent in the first. Nonresidential structures increased 0.9 percent, compared with an increase of 12.9 percent. Equipment and software increased 7.2 percent, compared with an increase of 5.4 percent. Real residential fixed investment increased 9.7 percent, compared with an increase of 20.5 percent.
X & M: Real exports of goods and services increased 5.3 percent in the second quarter, compared with an increase of 4.4 percent in the first. Real imports of goods and services increased 6.0 percent, compared with an increase of 3.1 percent.
G: Real federal government consumption expenditures and gross investment decreased 0.4 percent in the second quarter, compared with a decrease of 4.2 percent in the first. National defense decreased 0.4 percent, compared with a decrease of 7.1 percent. Nondefense decreased 0.3 percent, in contrast to an increase of 1.8 percent. Real state and local government consumption expenditures and gross investment decreased 2.1 percent, compared with a decrease of 2.2.
Motor Vehicles GDP contribution was a +0.13 percentage point GDP contribution. Computer final sales, was -0.07 by percentage points. Motor vehicles are different from personal consumption, or C sub-component auto & parts, this is an overall separate index. Motor vehicles, computers are bought as investment, as fleets, in bulk, by the government and so forth.
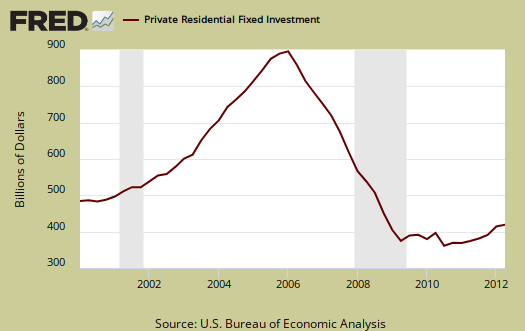
Residential fixed investment was +0.22 percentage point contribution to Q2 GDP, in comparison to a +0.43 percentage point contribution in Q1. Below are the raw totals on residential investment, not adjusted for inflation. One can see the housing bubble collapse in the below graph and also how there is no meteoric recovery for Q2.
Private, or not from the government, fixed investment was a +0.76 percentage point contribution to Q2 GDP. Nonresidential fixed investment coughed up a +0.54 percentage point contribution with +0.51 percentage points coming from equipment and software. Structures were nowhere, a +0.03 percentage point GDP contribution.

The price index for gross domestic purchases, was only 0.7% for Q2, whereas Q1 was 2.5%. In other words, there was way less inflation than last quarter, corresponding to the drop in oil for Q2. Core price index, or prices excluding food and energy products, was 1.4%. Q1's core price index was 2.4%.
Nominal GDP: In current dollars, not adjusted for prices, Q2 GDP, or the U.S. output, is $15.596 trillion,a 3.1% increase from Q1. The first quarter saw a 4.2% increase. Applying the price indexes, or chained, real 2005 dollars, Q2 2012 GDP was $12.701 trillion. Both numbers are annualized.
Here are past overviews for the GDP, text unrevised, most graphs are updated.
* In Table 2, the BEA reports GDP contribution components with their equation sign. If durable goods for example, decreased over the quarter or year, it is reported as a negative number. Imports, from the GDP equation, are already a negative for that is not something produced domestically. A negative sign implies imports increased for the time period and a + sign means the change in imports decreased. Or, from the GDP equation: . Confusing but bottom line exports add to economic growth, imports subtract.
Recent comments