
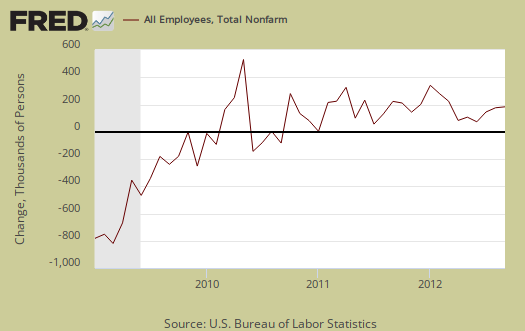
The BLS unemployment report shows total nonfarm payroll jobs gained were 114,000 for September 2012 and the unemployment rate dropped to an artificial 7.8%. Some better news was August's payrolls were revised up by 40,000 jobs to 181,000 and July was also revised up by 46,000 jobs to show a gain of 142,000 in nonfarm payrolls. The below graph shows the monthly change in nonfarm payrolls employment.
The BLS actually is two separate surveys and this month the two really diverged. CES or payrolls shows little job growth while the Household survey, or CPS shows an impossible gain of 873,000 employed people and a monthly drop of -456,000 in those officially unemployed. We've already covered these discrepancies in this article directly comparing the household to payrolls survey and another, showing labor force movements as well as part-time workers. Now let's take a look at the jobs reported by businesses, the other survey from the employment report.
There were 104,000 private sector jobs gained while government payrolls added 10,000 jobs. Manufacturing lost 16,000 jobs.
The start of the great recession was declared by the NBER to be December 2007. The United States is now down -4.482 million jobs from December 2007, 4 years and 9 months ago.
The below graph is a running tally of how many official jobs are permanently lost, from the establishment survey since January 2008. Amazing isn't it considering the time period of the below graph.
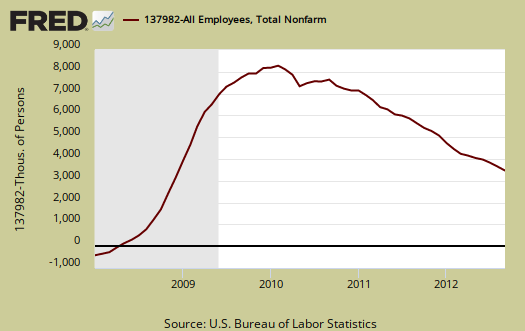
Manufacturing alone has lost 1.781 million jobs since January 2008. This month's loss of 16,000 is not good news.

Government gained 10,000 jobs for September and most of July's revisions were government jobs. That said, government, especially at the state and local level has been hemorrhaging jobs. Since January 2008, all government payrolls are down 375,000 jobs.

Construction has just been hammered due to the housing bubble collapse as well as the recession. This month construction gained 5,000 jobs yet from the beginning of the recession jobs in the construction field are down 1,958 million jobs.

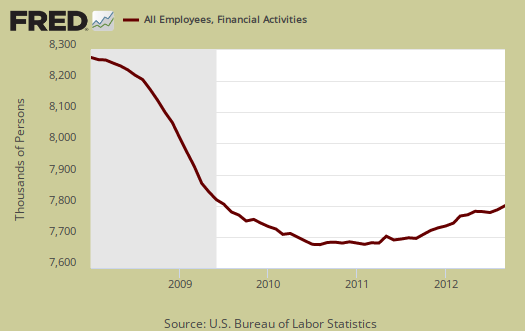
Financial activities payrolls are now down -461,000 jobs since the start of the recession. This month the financial sector gained 13,000 jobs.
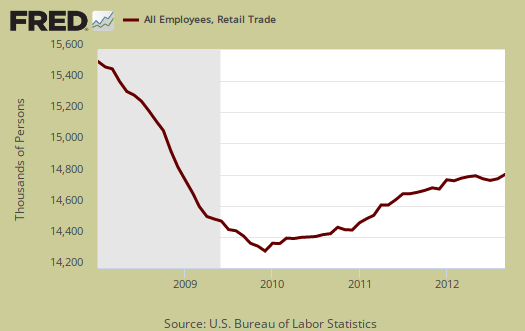
Retail trade, which are your retail sales outlets like big box marts, direct mailing and anything retailing merchandise, is down -804,000 jobs since the start of 2008.
Education and health services has consistently been increasing and this month was no exception 49,000 additional jobs and of those jobs 44.5 thousand were in health care and social assistance. A total of 1.805 million jobs have been gained in education & health services since the start of 2008.

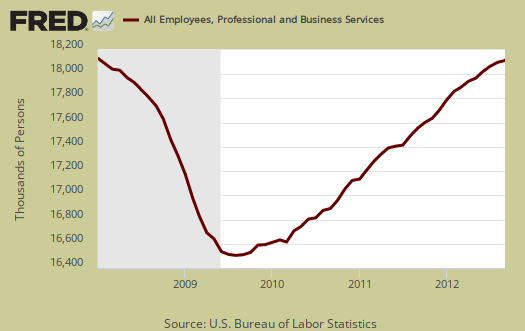
Professional & Business services contains management, career professionals, science & technical, administrative and support and finally waste services. This industry sector is only down 95 thousand jobs since the start of the great recession and this month added 13,000 jobs.
Transportation and warehousing also has still not recovered their jobs and are down -142,500 since January 2008. This is in spite of this month's good showing of 17,000. These are services for moving of people as well as cargo and also storage.

As we can see 114,000 in payrolls growth is actually terrible and depending on which labor participation rate one uses, really not enough to keep up with employing the growing U.S. work force.
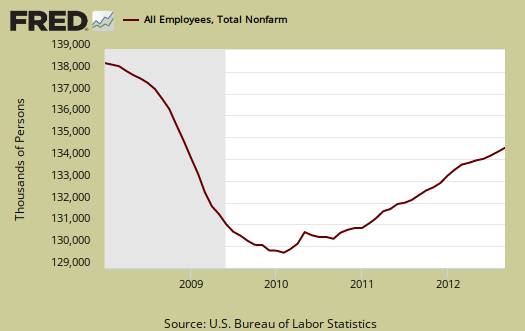
We also want to go back to 2008 for it seems the press and others forget, we simply have not recovered from the Great recession at all. There is a massive jobs deficit, no matter what the official unemployment rate does.
The BLS gives industry payroll breakdowns for more detail on payrolls and job growth per NAICS classified industries. From the employment report we can see while we have on average job growth, payrolls are not growing as fast as they were in 2011.
Total nonfarm payroll employment increased by 114,000 in September. In 2012, employment growth has averaged 146,000 per month, compared with an average monthly gain of 153,000 in 2011.
In September, employment rose in health care and in transportation and warehousing. Health care added 44,000 jobs in September. Job gains continued in ambulatory health care services (+30,000) and hospitals (+8,000). Over the past year, employment in health care has risen by 295,000.
In September, employment increased by 17,000 in transportation and warehousing. Within the industry, there were job gains in transit and ground passenger transportation (+9,000) and in warehousing and storage (+4,000).
Employment in financial activities edged up in September (+13,000), reflecting modest job growth in credit intermediation (+6,000) and real estate (+7,000).
Manufacturing employment edged down in September (-16,000). On net, manufacturing employment has been unchanged since April. In September, job losses occurred in computer and electronic products (-6,000) and in printing and related activities (-3,000).
Employment in other major industries, including mining and logging, construction, wholesale trade, retail trade, information, professional and business services, leisure and hospitality, and government, showed little change over the month.
There were also primarily benchmark adjustments released, outlined here. The primarily benchmark will increase March 2012 nonfarm payrolls by 386,000 and the private sector by 453,000 jobs. These figures will be incorporated into the data in February 2013, using a one year backwards linear distribution adjustment.
Payrolls are much more accurate than the household survey and by looking back to 2008, we see most industries have not recovered even the jobs lost. Various fractions try to spin the unemployment rate yet payrolls tell no lie, labor has not recovered from the recession.
Professional services numbers far too positive
Professional services are showing average wages of approx. $23/hr.+ and only down 95,000 since the beginning of the Great Depression Redux? Seriously, I know these are the numbers being used, but that can't be right. Especially when professional services are one of the biggest victims of outsourcing as we hear the message that if it can be done in front of a computer, the job can be shipped overseas for someone to do in front of a computer over there. Also when these numbers are showing those wages at 35+ hours/week but the use of part-time employees has exploded since Great Depression Redux as has been shown graphically here and elsewhere? And those would be the jobs paying the upper end of the professional services wages. Construction and manufacturing, no doubt, decimation, but professional services is brutal out there. This is also where the college and grad school unemploymed grads should be reflected, as well as all the folks from 30-60 with nice degrees being used for toilet paper, so I'm not getting how this is possible. There are problems I've noticed in the past too where BLS will say such and such industry is growing (but reality and job apps show otherwise without even getting into the fact Americans aren't being hired) and the average wage is say, $70,000, when that is far above the average wage.
professional services covers a large number of occupations
Is really broad and these are payrolls by industries, not occupations. From the BLS page on professional services, we see admin, support, waste is 8.025 million, management is 1.957 million and STEM, legal, accounting, advertising is 7.974 million, out of 17.956 million.
January 2008 is 4 yrs, 9 months ago, yet many of these industries have not recovered even the jobs lost during the great recession. Few seem to remember 2007 was not great for finding a job either. Then add in population growth and we're down a good 11 million jobs. I didn't calculate that out this month and am probably going refine how our "real jobs deficit" is calculated, but to do that I need the CPS and it was so funky this month, I believe it's going to swing back, that this was a statistical fluke, so I'll do our custom real jobs deficit next month.
So, STEM occupational statistics are buried in professional services and we don't have up to date numbers for STEM, the last was May 2011.
Also, within "computer jobs", this is where foreign guest workers are imported and counted as U.S. employed. I believe this is skewing the numbers and making it look like their are job gains when there are job losses, the U.S. worker was displaced by a foreign guest worker.
Last time I dug into STEM occupational data is in this detailed post, which shows H-1Bs were 22% of computer related jobs in 2009.
Check out the never ending S&T shortage lie and there are others who put the number of unemployed U.S. STEM much higher.
Here's another bone to pick with the BLS, their occupational projections are always wrong and it's pretty obvious we need to know the immigration status by occupation in the statistics.
Anyway, point is these are very large sectors in the monthly establishment survey payrolls report so it is probably right but that doesn't mean certain occupations are not being decimated or we do not have labor arbitrage, wage arbitrage going on.
The 22% of H1/L1s of STEM workers is suspiciously low
Bob, there is one empirical test for the size of the H1b as a percentage of STEM workers and an important annecdotal piece of evidence. H1s have had allocations of about 100K per annum for 20 years since 1990, or since the Berline Wall fell.
22% is far too low a number.
Many observers count the number of H1s at about 85% of STEM employment. The trick
is to guage the number of returns to the native lands. We do not know how many repatriations there are, or how many STEM H1s chose another line of work. The numbers are soft, and I beleive, kept empirically soft and ill-defined.
As an personal observation, I have not seen an office in the last 10 years where
the number of VISA workers and Green Cards in tech was below 80 percent. In the last year, I have been the only native born tech work in a shop of over 100 workers, in our biggest metropolis.
Burton Leed
references please
That's all computer jobs, an H-1B Visa is good for 6 years, so either they returned, became illegal or got a green card.
These figures come from the AFL-CIO DPE and sound reasonable for the private sector, but bottom line, we do not have the raw statistics available, so all one can do is estimate.
Anyway, you can quote even CIS on here or NumbersUSA for all I care but you need to cite a reference for 85% is clearly not true, even if one travels in Northern NJ, a hotbed for use of H-1Bs or goes to Bellevue Washington (Microsoft, a notorious labor arbitrager of technical people).
No, the entries and exits are simply entry and exits from the country, people fly back home all of the time and also travel elsewhere on guest worker Visas. You cannot take this number and extrapolate it to claim they are all taking computer jobs.
Additionally H-1Bs are used in other occupations, teachers being targeted is large.
You can even do a quick back of the napkin, 7 million tech jobs, 175k visas a yr * 6 yrs = 1.2 million H-1Bs ~ 17%.
That's just one guest worker Visa and if the extended time is past 6 years, which is can be, the number is higher. There are L-1s being used as well in tech and now we have OPT.
22% is outrageous actually. That's like the unemployment rate of Spain.
All H1 Figures are Estimates.
There are no good hard figures, that is the point about the Visa Workers.Programmer's Guild uses the 85% number, but that is based on the gross new H1bs and L1s granted by Congress. We do not know how many repatriate, or retire or choose other professions.
Nursing and Science jobs are are parts of this number. USCIS site would seem to give us a total or gross grant of H1Bs of about 74 percent. This number will not include 2012 or 2013. So the PG estimate of total grant of h1bs over 22 years is not far off at 85%. This number will not include L1 and other grants of Green Cards to the workers of MNC subsidiaires around the globe, A large work force is rotated onshore from offshore by MNCs.and foreign consulting firms.
Now the Department of Commerce chimes in with a rosy estimate of all STEM jobs
and does a slight redefinition of a STEM work as we have known these jobs with
the addition of "Life Sciences" subcategory. You can suspect medical hiring in this number:
See:http://www.esa.doc.gov/sites/default/files/reports/documents/stemfinalyj...
Burton Leed
sorry no
I am familiar with the Programmers Guild and they do not use 85%. An H-1B shouldn't be on that Visa since 1990, either they got a green card, or went back home, or possibly stayed illegally and thus are not working in tech. It is 6 years and they can be extended if waiting on a green card (for one).
Here are some references for estimating the raw number of H-1Bs. One from CIS, whose research I find ok but on the far right of the political spectrum and then the AFL-CIO DPE, whose figures I already quoted, on the left. Both have researched heavily into foreign guest workers for it negatively impacts their union members, main topic page here for the AFL-CIO DPE and then the overall immigration/migration issue.
This site is laden heavy with statistics, but those statistics must be accurate, using correct analytic methods. Both of these groups, CIS, AFL-CIO DPE I find their methodology valid, or to date have not seen a fatal assumption flaw. Interesting that the AFL-CIO DPE has their estimates higher than CIS.
Miano, who founded PG and moved onto CIS and is now an attorney has some solid numbers on H-1Bs as well. You maybe thinking of wages instead of workers. 85% of H-1Bs are paid way below the median wage.
NFIB partisan? Does it represent D & R and independents?
Any time I see an outright or almost outright reference to uncertainty and political climate regarding hiring, questions arise. I understand uncertainty, but that's the nature of business and life, and waiting for DC to figure out what a customer is going to need today or tomorrow is a waste of time. Decisions and payrolls require daily work, and looking to DC and politicians seems to be the new message we always here when a certain national agenda is sought, not the concerns of small and mid-level businessmen in blue and red states. If customers need something, the owner will address that need ASAP. If he/she doesn't have enough employees, he/she will hire more. If he/she doesn't, and the customers' needs aren't being met despite demand, then they'll shop elsewhere.
Check http://sourcewatch.org/index.php?title=National_Federation_of_Independen....
Yes, sourcewatch is probably partisan on the Dem. side, but it's a start for research on funding of NFIB.
"Uncertainty" is a fact of life, business owners, politicians, lobbyists, the young and old, generals and soldiers, students, grads, EMTs, doctors and nurses, the fully-employed and suffering unemployed deal with it daily. "Uncertainty"? Aren't the unemployed always told to spend tens of thousands of dollars more on more retraining and education in the hopes that someone will hire them in 1-4 years and with $20-$200,000 more in debt? Or to relocate anywhere in the world in the hopes that they might get hired somewhere without any assurances they'll get a job or keep it for a few years? How's that for uncertainty? And yet they are told to act and act now. It doesn't and shouldn't cause anyone to freeze in their tracks and look to DC for answers. Also, don't we always hear how "government is the problem, not the solution." Okay, if that's the case, why is a lobbying group telling us DC is the answer or the solution and we should wait for DC to settle things? And if government is the problem, why even spend any time or money dealing with it?
what was I thinkin? Thx Kurtz.
Post edited to remove NFIB. Must have been late and I confused them.
No prob - easy to spot talking points because of overuse
The problem is nowadays the talking points coming from the powers behind the scenes are overused - they got greedy so now they are used with the subtlety of a sledgehammer.
Any time I hear/read things like: "skills gap"; "uncertainty"; "fiscal cliff"; "lazy unemployed"; "overqualified"; "useless liberal arts"; "rather be collecting entitlements than working"; "just get a job at McDonald's, they are always hiring (said to engineers with four kids and 30 years of experience)"; "they are doing the jobs Americans won't do"; "financial regulation is bad for the public"; "the best and brightest are actually the best and brightest and deserve their pay"; "CEOs and boards look out for shareholders"; etc., I pay extra attention to who's saying it, what amazing things they have accomplished in school and/or work all on their own that allows them to lecture everyone on everything, and what they are paid to say. Then I laugh and move on.
grabbed the wrong thing, mainly wanted to show some detail
Lobbyists have no space on EP and I wanted to get out some graphs of general payrolls out there to show, while most focus on the monthly gains, or the quarterly gains, the "time Obama took office" or "the last year" and so on, the bottom line payrolls have not recovered at all from the recession. I think that fact is conveniently forgotten.
EP is just a voice from the wilderness and we want to keep it that way. No lobbyists, no spin, none of these fudged and manipulated statistics and other lies. Franky, I cannot believe they are invited to testify at Congressional hearings, I find that outrageous and clearly the oath and swearing in means nothing. Lie, lie, lie and bigger more outrageous lies. Major press repeating those lies.
Simply grabbed the wrong quote thinking it was from ADP or Challenger, SBA or something, sorry it was late. Anyway thx, and I really appreciate it for we do not want to publish mistakes on here. I worry about that statistically speaking, in spite of the fact we see major errors every day in the MSM.
A fake news channel blames one party only for part-time work
I subject myself to the noise and propaganda from both parties just to see that they never give up. Murdoch's little puppet show is blaming "health care"/"Obamacare" for the explosion in part-time workers being used by companies and all that "uncertainty." No doubt they really, really want to pay their workers full-time wages that always go up and up, it's that damn Obamacare stopping them. Golly gee, it's all about "Obamacare." Then again, the charts and stats here and elsewhere show the explosion in part-time workers vs. full-time workers began during Bush II, around 2000, and exploded again under the other party in 2007/2008. It seems companies use economic gloom to switch more and more workers to part-time work and lower wages while firing more and more people, it's not a one-party thing. Same goes for deregulation, open borders, outsourcing, and visa abuses. But of course both parties never responsible, it's always the other guy and his policies. Didn't know "Obamacare" was to blame back in 2000, but then again I'm not wearing a flag lapel pin and earning $10 million for reading a teleprompter.
obamacare made it to the ISM survey too
Yup, they really do not want to cover health insurance for our labor arbitraged low wage workers now do they?
They have been using part-time to deny benefits for over 20 years. Walmart one of the most notorious and yes, I do believe they can afford to provide health insurance to their employees.
I'm no fan of Obamacare for I think the best system seems to be universal single payer and that would entail extending Medicare/Medicare to all as the most expedient. Of course lobbyists would never let that happen for their boes their business models and profit margins.
So, we'll have to go look at "Obamacare costs" to small business from an objective analysis group (which is probably hard to find the facts!) So much snow.
No worries, soon interns will pay to work at Walmart, etc.
I think the "job creators" will soon hatch the genius idea that all workers need to be interns that need to pay to work so that they can gain valuable experience. If they do, I want my 1/1000 Walmart family fortune paid in full and I want to be labeled a job creator too.
I mean working in Walmart, who wouldn't want to pay for that experience? And HR could make themselves busy and never face getting fired by making the internship application process extremely tedious and complex, requiring HR to screen prospective interns for up to two years for the privilege.
Interns could gain valuable experience "interfacing in a customer-facing environment communicating in written and spoken languages requiring interns to understand regional accents when appropriate. Daily represent a corporation that has complex and important dealings with authorities in foreign countries involving secret cash payments. Interns must be able to move items ranging from 1 oz. to 500 pounds and time bathroom usage so that they do not urinate or defecate on themselves or customers. Interns must be able to walk and talk, often at the same time. If ever injured, interns must rely on health care provided by taxpayers and local authorities because Walmart will not be responsible in any way for such care. Interns must never question authority, unless that authority interferes with Walmart's corporate authority. Interns must prompty pay supervisors for the privilege of working. Any missed payments will be subject to interest payments. Interns must not communicate with any law enforcement, fire, or health authorities if such communications harm Walmart. Any communications with local, county, state, or federal authorities will be grounds for firing. Any work performed by the intern will be under the control of Walmart authorities, unless such work causes problems for Walmart, in which case said work will be disavowed and said intern will be solely and fully responsible for said work. Walmart demands background checks, including urine and hair samples, as well as 20 references from prospective interns. Also must allow access to all bank accounts, email accounts, all blood samples ever given, and names of all friends, associates, enemies, colleagues, and people that ever walked by intern applicant. Any reference to freedom, independence, the Bill of Rights, local, state, or federal laws will be deemed troublesome and grounds for temporarily being locked inside the store overnight until the intern can be blackballed from any other job Walmart Inc. has connections with."
Of course many other companies in the USA 2012 could be substituted for Walmart.
just a fyi, no new posts
I have a medical situation and can't get to them. Hopefully I'll have JOLTS and at least one other up soon. Sorry!
BLS new jobs almost all full-time?
For the BLS jobs report the inconsistencies mount:
marketwatch
Contrary to what most reports have been saying, this report says almost all of the 873,000 new jobs were full time! Many experts explained the discrepancy between the BLS household survey and the employer survey as due to the part-time numbers. But if in fact the household survey is also measuring full-times, is close to 1 million new FULL-TIME jobs in one month really believable? Why is the household survey new jobs count 8 times higher than the employer survey if they both are measuring full-time jobs? For statistical studies, when they most come under question is when they are INTERNALLY inconsistent.
At the rate the BLS is claiming our economy is now "booming" we can match the Romney claim of 12 million new jobs over 4 years in just one year!
I think you'll agree this number is not believable but that is indeed what the BLS data seems to be saying near the bottom of this table:
http://www.bls.gov/news.release/empsit.t09.htm
someone at Marketwatch made a boo boo
which is unusual for they usually get this right. This is the CPS survey folks, don't confuse this with the CES, which are the real jobs. Payrolls are the real jobs added per month. Trust me, if you watch this report for a while, the wild swings of the CPS just aren't to be compared monthly, except as a minor indicator.
Ok, what MarketWatch got wrong:
Table A-9 doesn't add. In other words, the breakdown of these jobs doesn't add and it is because each individual series in A-9 is separately seasonally adjusted and it's a separate survey question I believe, it is usually if that job is 35 hrs or less (part-time) or 35 hrs or more (full-time), not actual hours worked for the survey month. So, in other words, you can have a "full-time" job, yet get your hours temporary cut by your employer due to bad business conditions. Table A, A-8 asks how many hours did you work. Big Difference. In other words, table A-9 asks "is your job classified as part-time or full-time", whereas table A and table A-8 asks "how many hours did you work in the survey reference week".
Below are the values quickly calculated from each table:
=====================================================
From table A-9:
full-time increased: 838,000
part-time decreased: -26,000
part-time total Sept: 27,731,000
at the top of A-9, their total (matches table A) 142,974,000
full-time + part-time added from the section quoted in Sept: 142,957,000
change from August from table A-9: 812,000
Note below table A-9:
=============================================
Table A:
Jobs (CPS) increased: 873,000
part-time (all) increased: 322,000
part-time total Sept: 27,349,000
total employed Sept: 142,974,000
implied total full-time: 115,625,000
===================
Table A-8
total part-time: 27,349,000
total full-time: 115,629,000
total jobs added: 142,978,000
difference from August in part time: 322,000
difference for part-time + full time from August: 886,000
===========================================
So, you can see table A-9 doesn't tally by full-time and part-time jobs and that's why the note on table A-9. So, using it to claim all of the jobs "growth" was full-time is an error.
Table A is more close but this series too is independently seasonally adjusted.
I believe table A-9 is a separate survey question versus the other tallies and why it doesn't match up to table A.
=======================================
First, people are mistaking part-time jobs with part-time for economic reasons jobs, which are about 46% of all part-time. It's not part-time jobs which increased that's the story and anybody trying to say that about the tally on the crazy CPS is amplifying a statistic that I sure wouldn't do on monthly basis due to the above disparities...
Marketwatch maybe or someone are confusing part-time with forced part time, known as part-time for economic reasons. That's the number which blew through the roof but as we've said in the "big picture" of things, we rally need to watch a few months to see a trend in the CPS AND the really big story is the drop in temp. jobs and those "flows" imply less people were fired.
JOLTS can confirm that but it won't come out for another month.
I'm kind of surprised, unlike AP, Bloomberg et. al, Marketwatch rarely makes a mistake on these.
another CPS misconception going on
People keep calling statistics from the CPS "jobs". They are not "jobs", they are people. So it's not "part-time jobs" it's people who worked part time hours. It's not "jobs", it is "people who are employed" and so on. Payrolls, or CES are jobs, the Household survey or CPS are people.