
The Manufacturers' Shipments, Inventories, and Orders report shows factory new orders plunged -5.2% for August 2012. This Census statistical release is called Factory Orders by the press and covers both durable and non-durable manufacturing orders, shipments and inventories. This is the largest monthly drop since January 2009, although July showed a 2.6% increase. In other words, we had an unusual bump up in July from which to fall. Below is the value of manufacturing new orders on a monthly basis and this report is not adjusted for inflation.

Manufactured durable goods new orders cliff dove -13.2% for August and part of the reason was nondefense aircraft, which carpet bombed the manufacturing statistics with a volatile -101.8% monthly percentage change. Motor vehicles bodies, trailers & parts manufacturers' wheels came off, with a -14.9% monthly decline in new orders. Notice the gray bars in some graphs to show recessionary periods. Some in the press are also blaming computers, not so. Their new orders increased 11% for the month. It was electronics which bombed out for August, with communications equipment leading the pack. Nondefense communications equipment dropped -7.0% and this sector has been heavily offshored. Computers, also heavily offshored are less than $1 billion in new orders for the month, whereas electronic measuring and test is almost $6 billion. Motor vehicle bodies, trailers & parts were $18.6 billion in new orders for the month to show the scale of these sectors in the new order monthly tallies.
This is the worse durable goods one month drop since January 2009's -14.3% decline. If we take the last three months, June-August 2012, the annualized percentage change was 0.3% in durable goods new orders. The previous three months, March-May 2012, showed an annualized -14.2% drop in durable goods from December 2011-February 2012. In further contrast, all of 2008 showed contraction for durable goods, along with the first three months of 2009. Below is a graph of durable goods, quarterly and annualized percentage change against real GDP's annualized percentage change, up to Q2 2012. Durable goods is value, not volume, thus not adjusted for inflation, whereas real GDP is. The Great recession was in part deflationary before Helicopter Ben stepped in.

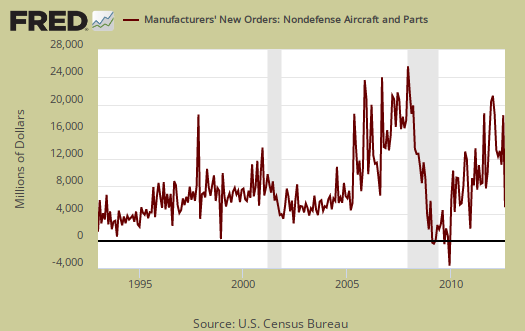
In other words, this report ain't good, but durable goods new orders are not the guaranteed economic Armageddon neutron bomb some are claiming. Below is a graph of just nondefense air-o-plane new orders to show how crazy wild aircraft new orders are.
When we look at core capital goods it's better news. New orders increased 1.1% for the month. Core capital goods are capital or business investment goods and excludes defense and aircraft. Ccore capital goods new orders declined -5.6% for July and -2.7% for June. Capital goods are a subcategory of durable goods.

Graphed below are nondurable manufactured goods new orders, which increased 2.2% in August and reduced the manufacturing new order slaughter. Notice that nondurable goods manufacturing also follows recessions and is not in contraction in the below new order graph.

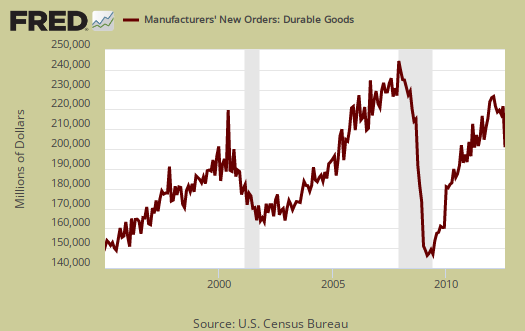
Shipments overall decreased -0.3% with durable goods shipments dropping -2.9%, a terrible sign. But by percentage changes isn't anywhere near 2008/2009. Below is the value of durable goods shipments, where we see this month's dramatic dip.

Below is a graph of core capital goods shipments, which declined -0.7% and July core capital goods shipments dropped -1.6%.

Core shipments contributes to the investment component of GDP, so the fact we have declines for the first two months of Q3 is really not a good sign. Producer's Durable Equipment (PDE) is part of the GDP investment metric, the I in GDP or nonresidential fixed investment. It is not all, but part of the total investment categories for GDP, usually contributing about 50% to the total investment metric (except recently where inventories have been the dominant factor). Producer's Durable Equipment (PDE) is about 75%, or 3/4th of the durable goods core capital goods shipments, in real dollars, used as an approximation. Next month we'll estimate this component to GDP.
Inventories for manufacturing overall increased 0.6%. Core capital goods inventories increased 0.4%. Inventories of manufactured durable goods increased 0.6%. Transportation equipment inventories jumped 1.5%. Nondurable goods inventories increased by 0.6%. Petroleum refineries inventories increased 3.3%.

The inventory to shipments ratio is 1.28, whereas July's ratio was 1.27. This implies an increase of inventories to completed sales.

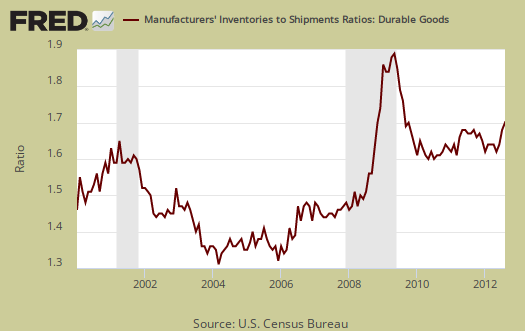
Durable goods inventories to completed sales ratios has been elevated since 2008 and now stands at 1.67, a clear uptick and graphed below.
Unfilled Orders is one of those unsung indicators and overall declined -1.7%. Unfilled orders are only for durable goods and show what kind of backlog manufacturers have. A decrease might imply slowing and layoffs. Core capital goods unfilled orders declined -1.5%. There are all sorts of nasty screaming gems of bad news in this report and this is one of them.

Part of this report goes into GDP. The BEA takes this report, called M3, and uses the shipments values to calculate investment in private equipment, investment in software. Manufacturing inventories also goes into the changes in private inventories GDP calculation. At the bottom of this post is a little more information to estimate part of the GDP investment component.
The St. Louis Federal Reserve FRED graphing system has added individual NAICS data series from this report. If you're looking for a graph of some particular NAICS category, such as light trucks, autos & parts, or machinery, it might be found on FRED. Most news outlets source the Commerce Department, while technically correct, also makes it impossible for you, our beloved detailed reader, to find the actual statistical report and data. We like to link directly to the statistical release and cite who actually is issuing those statistics.
Here is last month's overview on factory orders, unrevised.
Recent comments