
The Manufacturing, Trade, Inventories & Sales for January 2010 is out. Sales were up 0.6% from last month, inventories were unchanged, 0.1% and the inventory to sales ratio is 1.25.
Below is a graph of the sales to inventories ratio.

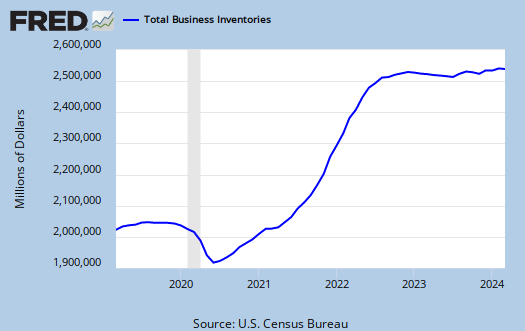
As you can see the inventories look like they have adjusted to pre-recession levels.
Here are inventories and you can see the run up as sales fell off of a cliff and the fall down as businesses slashed and burned the inventories they had on hand, not expecting a hell of a lot of sales. So, inventory roller coasters do look to be over:
Here is the percent change, which is per data point, in this case month to month. Pretty dramatic inventory slash huh? See below that sudden rise, indicating a much smaller monthly change, in Q4 2009? That's our "GDP".
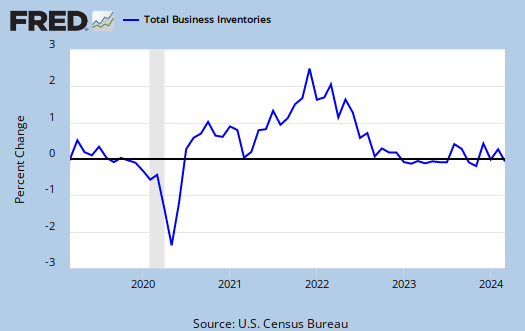
But as you can see that swing, that variance in the inventory change has decreased. So, don't look to inventories to artificially boost GDP to the extent it did in Q4 2009.
Wholesale inventories dropped -0.2% while sales increased 1.3%. Wholesale inventories ratio is now 1.10, meaning they have 1.1 months worth of stuff around to sell before they must make or get more stuff. This maybe a sign of new hires, we will see, and that's because demand, i.e. sales, increased, of course it could also be a blip on the screen.
But in terms of Q1 GDP being more inventories, well, we're seeing a fairly flat line at this point.
picture
Would you please tell me what software did you use to generate those pictures? Is that SAS? Thanks!
these particular graphs from St. Louis Federal Reserve
The Saint Louis Federal Reserve has some fantastic online graphing tools with online databases of economic reports. They don't cover everything but quite a bit.
These graphs are using the Federal Reserve FRED tools. That said, you have to know what they mean at least by compounded, percent change, annual percent change and so on.
SAS? What? From what I can see the Fed has used a series of web technologies and CGI scripts for their graphs. I know they use javascript but not java and they also have APIs, might be Python, it's screaming fast server side, or PHP, which fast...uh, not so much.