
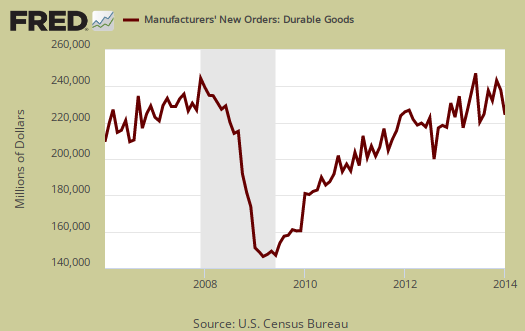
The Durable Goods, advance report shows new orders declined by -1.0% for January 2014, but December 2013 new orders were revised downward to a -5.3% plunge. The better news of this report is core capital goods increased by 1.7%. For the last three of four months durable goods new orders as a whole have declined. The culprit for January's durable goods new orders decline was transportation new orders, yet without the Department of Defense buoying up durable goods by ordering stuff, the overall monthly decline would have been -1.8%.
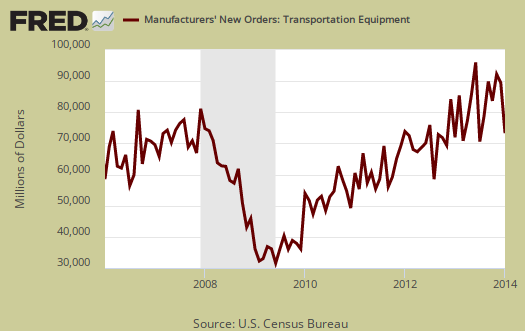
Below is a graph of all transportation equipment new orders, which plunged by -5.6% for the month. This is not just due to volatile aircraft orders as motor vehicles & parts declined by -2.2%, not a good sign. Aircraft and parts new orders from the non-defense sector decreased -20.2%. Aircraft & parts from the defense sector increased by 19.4%. Aircraft orders are notoriously volatile, each order is worth millions if not billions, and as a result aircraft manufacturing can skew durable goods new orders on a monthly comparison basis.
Core capital goods new orders increased by 1.7%. December's core capital goods new orders decreased by -1.8%. Core capital goods is an investment gauge for the bet the private sector is placing on America's future economic growth and excludes aircraft & parts and defense capital goods. Capital goods are things like machinery for factories, measurement equipment, truck fleets, computers and so on. Capital goods are basically the investment types of products one needs to run a business. and often big ticket items. A decline in new orders indicates businesses are not reinvesting in themselves. This month it appears fabricated metal products is what saved the day with core capital goods. By themselves new orders increased 7.3%.

To put the monthly percentage change in perspective, below is the graph of core capital goods new orders, monthly percentage change going back to 2000. Looks like noise right? We use so many graphs to amplify trends for one month of data does not an economy make, so be aware month to month changes can be very misleading.

Shipments didn't fare well and dropped -0.4% after a -1.8% decline in December. New orders are not necessarily shipped the next month an order is made. Below is the monthly shipments; percent change for all durable goods shipments.

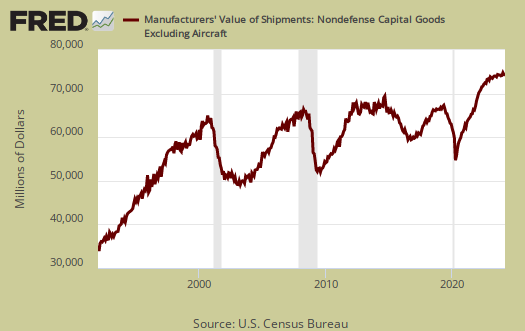
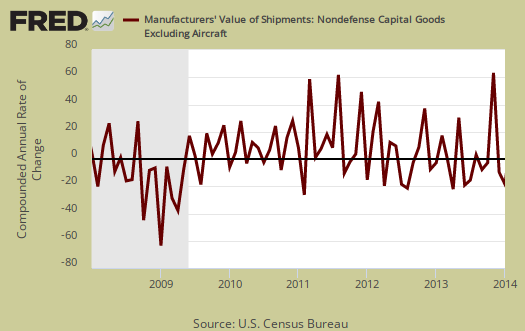
Shipments in core capital goods decreased -0.8%. The below graph goes back to 1990 to show how core capital goods shipments tracks recessions, the gray bars in the graph. This is just one indicator but it sure appears the economy overall is giving mixed messages.
Inventories, which also contributes to GDP, increased 0.3%. The revision to December's inventories was not that significant, and Q4 GDP revisions will be released tomorrow. Graphed below are total durable goods inventories monthly figures.

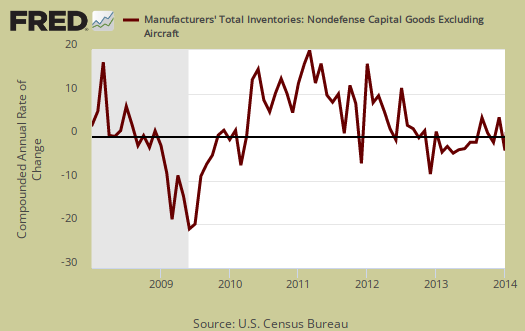
Core Capital Goods inventories decreased -0.2% for the month. Graphed below are monthly core capital goods inventories annualized percentage change and pay close attention to the months of Q3, against the Q4 months. The below implies we will not see too much of a revision to this portion of inventories component in Q4 GDP.
Core shipments contributes to the investment component of GDP. Producer's Durable Equipment (PDE) is part of the GDP investment metric, the I in GDP or nonresidential fixed investment. It is not all, but part of the total investment categories for GDP, usually contributing about 50% to the total investment metric (except recently where inventories have been the dominant factor). Producer's Durable Equipment (PDE) is about 75%, or 3/4th of the durable goods core capital goods shipments, in real dollars, used as an approximation. Below is the national accounts description of PDE:
Nonresidential PDE consists of private business purchases on capital account of new machinery, equipment such as furniture, and vehicles (except for personal-use portions of equipment purchased for both business and personal use, which are included in PCE), dealers' margins on sales of used equipment, and net purchases of used equipment from government agencies, from persons, and from the rest of the world.
The below graph might give a feel for what kind of investment component we might see in Q4 GDP revisions, based on PDE. Note the below is the annualized monthly percentage change of nominal values, not real, not adjusted for inflation, for core capital goods shipments.
Economists, the press and pundits are blaming the weather for economic declines. The winter is unusual but only in certain areas of the country is it shutting down business as usual. We believe it is having an impact, but is not the culprit for all bad news. How much of an impact can just be estimated at this point, but industries concentrated in the Midwest have been especially affected. Even though economic reports are seasonally adjusted, they cannot account for unusual weather that hasn't been this bad in over 50 years.
The report excludes semiconductor manufacturing and we must wonder if that means it is non-existent since so much has been offshore outsourced and thus corporations don't want the public to figure that fact out.
What is a durable good? It's stuff manufactured that's supposed to last at least 3 years. Here are our durable goods, related overviews, only some graphs revised. The durable goods advance report is often revised when the full factory orders statistics are released.
Recent comments