
Q2 GDP 2011 came in at 1.3%.. Here is the original BEA GDP report. Q1 2011 GDP was revised down to 0.4%.
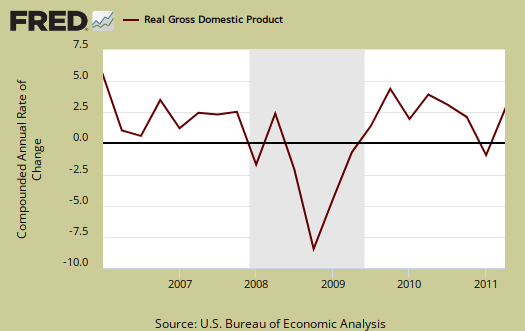
Q2 GDP had a sharp decrease in personal consumption and a drop in imports, a bump up in federal government spending and signs of life in investment.
As a reminder, GDP is made up of:
where
Y=GDP, C=Consumption, I=Investment, G=Government Spending, (X-M)=Net Exports, X=Exports, M=Imports*.
Here is the Q2 2011 advance report breakdown of GDP by percentage point contributions:
- C = +0.07
- I = +0.87
- G = –0.23
- X = +0.81
- M = –0.23
Here is the Q1 2011 report, with the latest revisions, breakdown of GDP by percentage point contributions:
- C = +1.47
- I = +0.47
- G = –1.23
- X = +1.01
- M = –1.35
Below are the percentage point differences, or spread between the Q2 advance and Q1 2011 GDP report components. This represents the change of gross domestic product growth contributions from Q1 to Q2. The quarterly change in private inventories was a -0.14 spread and trade was a +0.92 point spread.
- C = -1.40
- I = +0.40
- G = +1.00
- X = -0.20
- M = +1.12
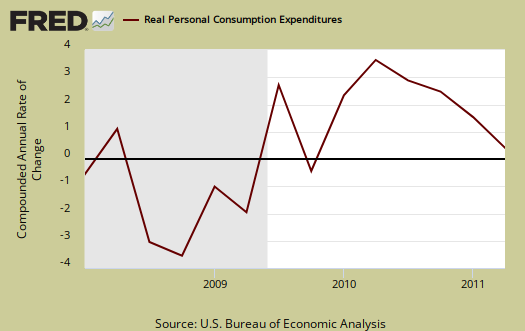
Below the the St. Louis FRED graph for C, or real personal consumption expenditures of the above GDP equation. As we can see from the above, while PCE, or C in the above equation, crashed close to zero.
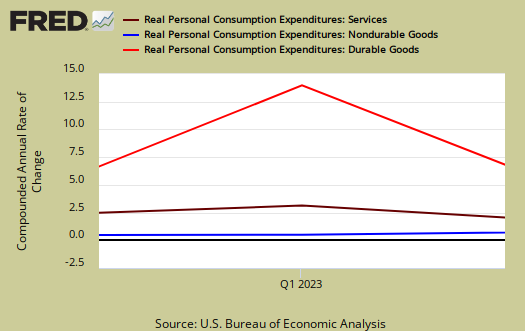
Below is the breakdown in C or real PCE annualized change. Notice when times are tough, durable goods (bright red) consumption drops. Notice the drop in durable goods this quarter. Overall, goods personal consumption was –0.33 percentage points of GDP in comparison to a +1.10 percent point contribution in Q4. Durable goods has a –0.35 percentage point contribution in Q2, or a -4.4% decrease, in comparison to a 0.85 point contribution last quarter.
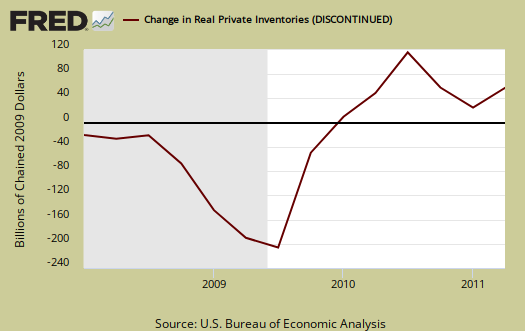
Changes in private inventories added 0.18 percentage points to Q2 2011 1.3% GDP. Last quarter changes in private inventories contributed a +0.32 percentage point change. Notice how this point contribution almost equals the total point percentage change for Q2 GDP, 0.4%.
Below are real final sales of domestic product, or GDP - inventories change. This gives a better feel for real demand in the economy. This is the better news of this GDP release, it shows real demand increased 1.1%, versus a flat line of less than 0.1% for Q1.

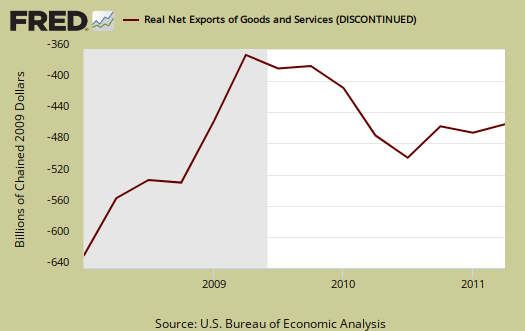
Below are net exports, or trade deficit, in real chained dollars, for Q2 2011.
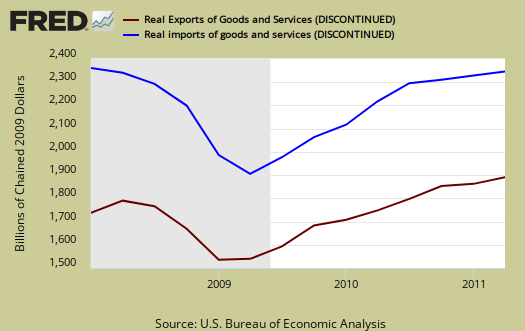
The below graph shows real imports vs. exports. While exports increased 6% from last quarter, we have a deceleration of trade generally for Q1 exports increased 7.9%. Q2 imports increased 1.3% versus a 8.3% change for Q1. Bottom line, it is the trade deficit that matters for GDP, although volume of trade implies a slower global economy as well. Q2 trade deceleration, especially imports, actually helped overall Q2 GDP.
Below are the percentage changes of Q2 2011 GDP components in comparison to Q1. Realize there is a difference between percentage change and percentage point change. Point change adds up to the total GDP percentage change and is reported above. The below is the individual quarterly percentage change, against themselves, of each component.
- C = +0.1%
- I = +7.1%
- G = –1.1%
- X = +6.0%
- M = +1.5%
The BEA's comparisons in percentage change breakdown of 2nd quarter GDP components are below. Changes to private inventories is a component of I.
C: Real personal consumption expenditures increased increased 0.1% in Q2, compared with an increase of 2.1% in Q1. Durable goods decreased 4.4%, compared with an increase of 11.7%. Nondurable goods increased 0.1%, compared with an increase of 1.6%. Services increased 0.8%, the same as Q1.
I: Real nonresidential fixed investment increased increased 6.3% in the Q2, compared with an increase of 2.1% in Q1. Nonresidential structures increased 8.1%, in contrast to a decrease of -14.2%. Equipment and software increased 5.7%, compared with an increase of 8.7%. Real residential fixed investment increased 3.8%, in contrast to a decrease of -2.4%.
X & M: Real exports of goods and services increased 6.0% in Q2, compared with an increase of 7.9% in Q1. Real imports of goods and services increased 1.3%, in contrast to a increase of 8.3% in Q1.
G: Real federal government consumption expenditures and gross investment increased 2.2% in the Q2, in contrast to a decrease of -9.4% in Q1. National defense increased 7.3%, in contrast to a decrease of -12.6%. Nondefense decreased -7.3%, compared with an decrease of -2.7%. Real state and local government consumption expenditures and gross investment decreased -3.4%, the same as Q1.
Motor Vehicles subtracted -0.12 percentage points to Q2 real GDP while computer final sales added +0.15 percentage point changes. This is different from personal consumption, or C auto & parts. Motor vehicles are bought as investment, as fleets by the government and so forth and in Q2, they bought less.
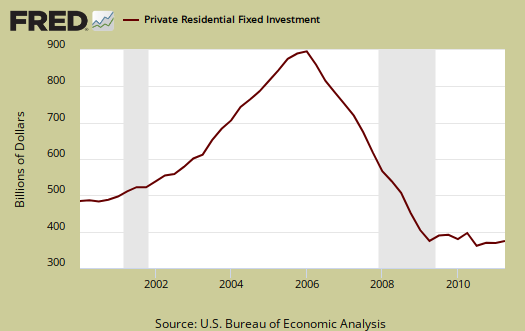
Residential fixed investment added +0.08 percentage points to Q2 GDP after subtracting a paltry -0.06 percentage points in Q1. Below is the raw totals on residential investment. If one could ever see the housing bubble and then it's collapse in terms of economic contributions, the below graph is it. Residential fixed investment changed +3.8% from Q1 2010.
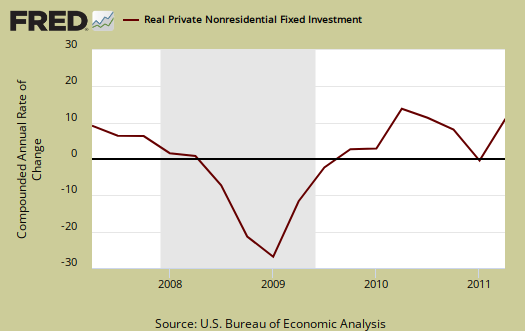
Private, or not from the government Nonresidential investment improved, with a 6.3% change from last quarter and a 0.61 percentage point contribution to Q2 GDP. Structures was a 0.20 percent point contribution, or a 8.1% percentage change from Q1 to Q2.
Here are the overview for the Q1 2010 GDP, 3rd revision report, but this quarter the BEA has revised, significantly GDP reports, to be overviewed in another post.
* In Table 2, the BEA reports GDP contribution components with their equation sign. If durable goods for example, decreased over the quarter or year, it is reported as a negative number. Imports, from the GDP equation, are already a negative for that is not something produced domestically. A negative sign implies imports increased for the time period and a + sign means the change in imports decreased. Or, from the GDP equation: . Confusing but bottom line exports add to economic growth, imports subtract.
graphs up to date now
There were problems updating some of the graphs and now they are all up to date with the revised data and Q2 advance data.
The one to look at is the breakdown of PCE, now the graph shows the dramatic decline in durable goods.
That is not a good sign.
Answer to ZeroHedge's the "Numbers do not Add"
Zero Hedge has a post implying the Q2 GDP numbers do not add and makes the point of how we have many economic reports, which go into GDP calculations, which slowed in comparison to Q1 GDP, which was flat lined.
The answer to how Q2 GDP could be higher to Q1 is in the fact this is the advance report.
I will bet you dollars to donuts Q2 GDP is revised significantly downward. The reason is imports. Imports this report were shockingly low. That said, the data that comes into the BEA always has delays. That's why the advance is marked "advanced" and why GDP is revised 2 more times in just a month or so time span, never mind the larger revisions as more data comes in.
Beyond Japan, the trade deficit report from last month doesn't really signal this low of imports and from experience, trade numbers are often significantly revised, due to the delays from the real data collected at the border.
I also wouldn't be surprised to see changes in private inventories be revised up and I sure wouldn't be surprised to see residential investment revised down.
Anyway, there is no CT going on here, more don't you wish we had more accurate and real time macro statistics?
Think about collecting all of that raw data for a national economy and some of the arcane data collection methods in comparison to today's immediate technology world.