
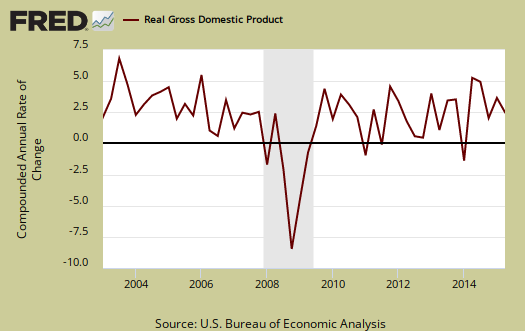
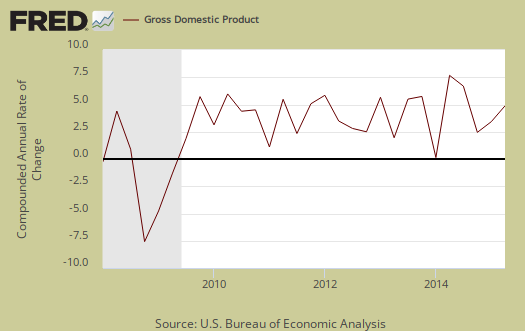
For the second quarter GDP bounced back to 2.3%. The BEA revised the national accounts back three years and now Q1 GDP is 0.6% instead of the -0.2% previously reported. The revisions may have improved Q1 2015 Gross Domestic Product, but on average, lowered GDP for the last three years by 0.3 percentage points. From 2011 to 2014 real GDP was 2.0% instead of the previous average of 2.3%. That's quite a stunt in economic growth overall.
As a reminder, GDP is made up of: where Y=GDP, C=Consumption, I=Investment, G=Government Spending, (X-M)=Net Exports, X=Exports, M=Imports*. GDP in this overview, unless explicitly stated otherwise, refers to real GDP. Real GDP is in chained 2009 dollars.
Tthe below table shows the GDP component comparison in percentage point spread from Q1 to Q2. Lest we forget, trade data is always delayed and we believe imports will be revised much higher, potentially causing a Q1 GDP contraction.
| Comparison of Q1 2015 and Q2 2015 GDP Components | |||
|---|---|---|---|
|
Component |
Q1 2015 |
Q2 2015 |
Spread |
| GDP | +0.64 | +2.32 | +1.68 |
| C | +1.19 | +1.99 | +0.80 |
| I | +1.39 | +0.06 | -1.33 |
| G | -0.01 | +0.14 | +0.15 |
| X | -0.81 | +0.67 | +1.48 |
| M | -1.12 | –0.54 | +0.58 |
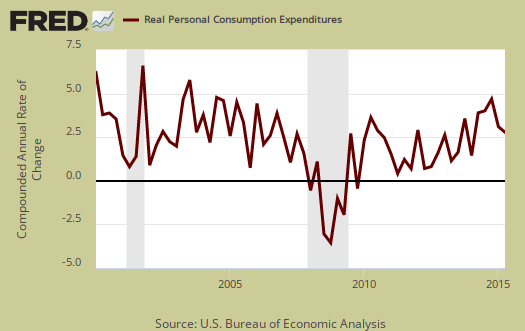
Consumer spending, C recovered from Q1 and contributed almost two percentage points to Q2's 2.3% GDP. Motor vehicles came back with a 0.26 percentage point contribution. Durable goods overall was a 0.53 percentage point contributio. Consumer spending services added 0.95 percentage points with health care by itself adding 0.31 percentage points to GDP. That is an enormous growth of spending just on health care. Below is a percentage change graph in real consumer spending going back to 2000.
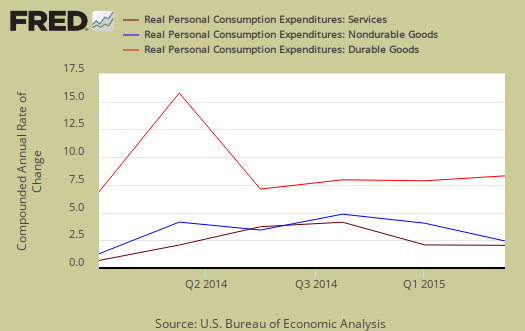
Graphed below is PCE with the quarterly annualized percentage change breakdown of durable goods (red or bright red), nondurable goods (blue) versus services (maroon).
Imports and Exports, M & X were a small 0.13 percent point positive GDP growth contribution. This is a huge improvement from last quarter, yet we must caution, trade data is always revised, usually negatively, with the next GDP revision. Exports were a 0.67 percentage points as imports were -0.54 percentage points.

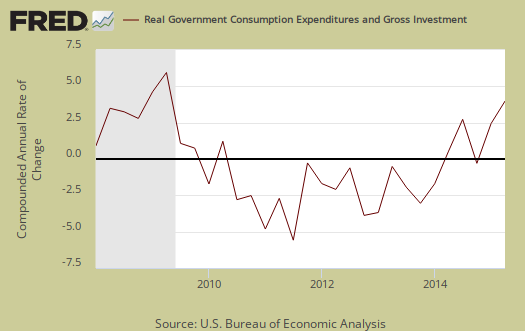
Government spending, G contributed 0.14 percentage points to Q2 GDP. The growth was all state and local as their gross investment added 0.18 percentage points to GDP.
Investment, I is made up of fixed investment and changes to private inventories. Investment contributed a paltry 0.06 percentage points to Q2 GDP. The change in private inventories alone was -0.08 percentage point contribution, which exposed the lack of fixed investment growth. Below are the change in real private inventories and the next graph is the change in that value from the previous quarter.


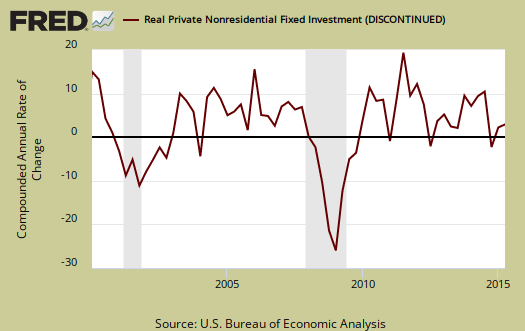
Fixed investment is residential and nonresidential and was a 0.14 percentage point GDP contribution. Nonresidential structures simply imploded with a -0.07 individual percentage point contraction. Information processing equipment pulled off -0.26 GDP percentage points. Intellectual property products contributed 0.22 points, but one must wonder how fictional is this category since intellectual property is packaged into special purpose vehicles located outside of the United States in tax haven areas.
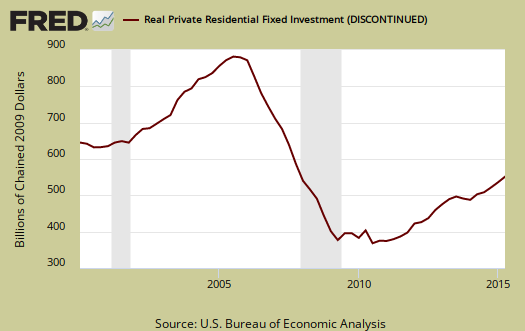
Residential fixed investment added only 0.21 percentage points to GDP. The below graph shows residential fixed investment.
Nominal GDP: In current dollars, not adjusted for prices, of the U.S. output,was $17,840.5 billion, a 4.4% annualized increase from Q1. In Q1, current dollar GDP increased 0.8%.
Real final sales of domestic product is GDP - inventories change. This figures gives a feel for real demand in the economy. This is because while private inventories represent economic activity, the stuff is sitting on the shelf, it's not demanded or sold. Real final sales increased 2.4%. This is the better news of this report, as Q1 showed a real final sales -0.2% contraction.

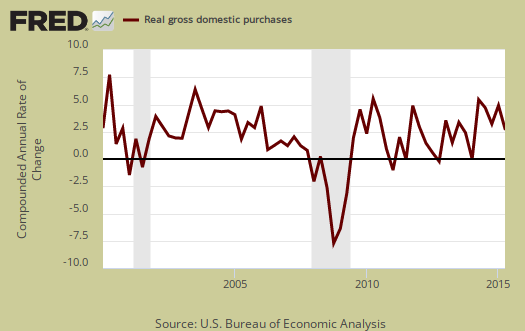
Gross domestic purchases are what U.S. consumers bought no matter whether it was made in Ohio or China. It's defined as GDP plus imports and minus exports or using our above equation: where P = Real gross domestic purchases. Real gross domestic purchases increased 2.1% in Q2. Exports are subtracted off because they are not available for purchase by Americans, but imports, of course are available for purchase in the U.S. When gross domestic purchases exceed GDP, that's actually bad news, it means America is buying imports instead of goods made domestically. Q1 saw a 2.5% increase in gross domestic purchases so for Q2 we have quite an improvement.
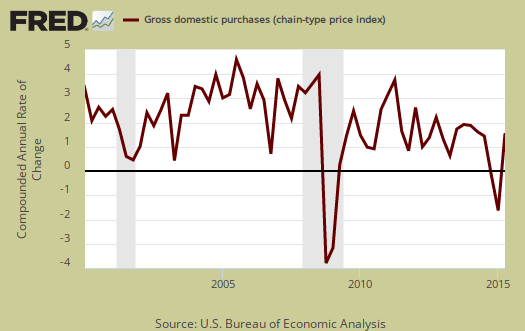
The price index for gross domestic purchases increased 1.4% for Q2. Without food and energy considered, the core price index increased 1.1%. This is must higher than Q1's 0.2%, yet below the Federal Reserve's target inflation rate. Below is the price index for gross domestic purchases.
Below are the percentage changes of the Q2 2015 GDP components, from Q1. The thing to notice is how exports improved for Q2. There is a difference between percentage change and percentage point change. Point change adds up to the total GDP percentage change and is reported above. The below is the individual quarterly percentage change, against themselves, of each component which makes up overall GDP. Additionally these changes are seasonally adjusted and reported by the BEA in annualized format.
|
Q2 2015 GDP Component Percentage Change (annualized) |
|||
|---|---|---|---|
| Component | Percentage Change from Q1 | ||
| GDP | +2.3% | ||
| C | +2.9% | ||
| I | +0.3% | ||
| G | +0.8% | ||
| X | +5.3% | ||
| M | +3.5% | ||
With never ending revisions to GDP, one starts to wonder the value of this report in the first place. At best the GDP report is becoming more crude in understanding what is really going on in the economy.
Other overviews on gross domestic product can be found here. The BEA GDP site is here.
construction spending again
i know, it seems that's all i talk about...
in the report on June construction spending (pdf), the Census Bureau estimated that our seasonally adjusted construction spending would work out to $1,064.6 billion annually if extrapolated over an entire year, which was 0.1 percent (±1.5%)* above the revised May estimate of spending at a $1,063.5 billion annual rate, 12.0 percent (±2.1%) above the estimated adjusted and annualized level of construction spending of June of last year, and the fastest annual rate in nearly a decade ...the May construction spending estimate was revised from $1,035.8 billion annually to $1,063.5 billion, the April estimate was revised from $1,027.0 billion to $1,044,641 billion annually, so while most media coverage focused on the small 0.1% headline print, construction spending was actually at a rate 2.8% higher than last reported once those revisions are taken into account...this should imply a substantial upward revision to 2nd quarter GDP...
rjs
how about write...
How about overviewing the construction spending report on EP and talk about the GDP impact there.
how about PCE or trade?
my synopsis of this weeks reports - and there were a lot of them - just had a couple paragraphs on the construction report, one of which you already see above...i have a good 5 paragraph overview of the incomes and outlays report, and 4 paragraphs on international trade...i was planning to post the former here tomorrow morning...
rjs
sure
if you want to write up some analysis on reports I missed that would be awesome, I could use the help obviously. ;)