
The U.S. June 2012 monthly trade deficit declined $5.12 billion to $42.924 billion. This is a -10.66% monthly decrease in the trade deficit, mainly due to increased exports. Exports increased $1.666 billion, or +9.09%. Imports declined $3.454 billion, a -1.49% decrease from May and mainly due to lower crude oil prices. This is the smallest monthly trade deficit in 18 months.

The three month moving average gives a trade deficit of $47.188 billion, down from $50.419 billion in May.
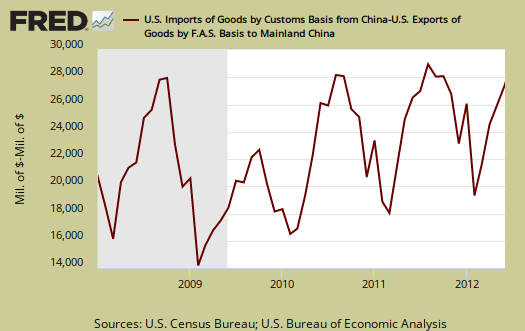
The U.S.-China goods trade deficit alone was, $27.401 billion, or 46.5% of the total goods trade deficit. The not seasonally adjusted China-U.S. goods trade deficit increased $1.358 billion, or +5.2% from last month. The 46.5% ratio includes oil, our biggest commodity import. For comparison's sake the not seasonally adjusted goods trade deficit by Census accounting methods was -$58.957 billion. China's never ending import barrage is highly cyclical as one can see in the below graph of the deficit with China.
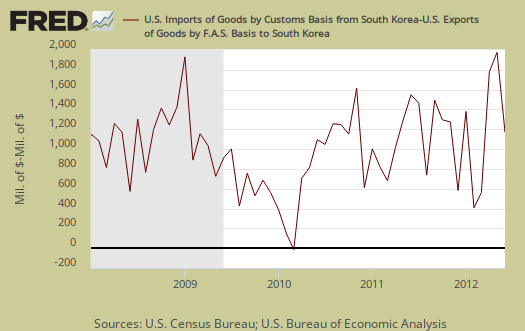
We should also mention the quick to increase South Korea-U.S. trade deficit. From January to June 2012 we have a $7.246 billion trade deficit with Korea, a $832 million increase from a year ago. March 15th the South Korean NAFTA style trade deal went into effect. Below is a graph of the Korean goods trade deficit, not seasonally adjusted and also cyclical, in particularly the cyclical high point seems to be December. This month showed a significant Korean trade deficit decline but we don't expect this to last.
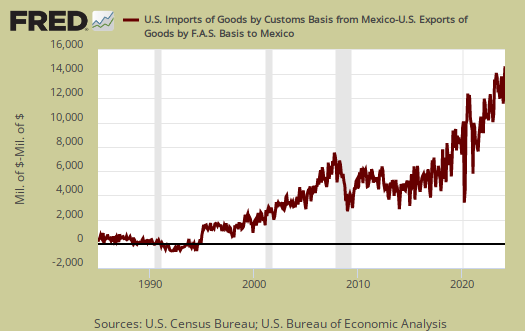
For comparison's sake, NAFTA went into effect January 1, 1994. Below is our goods trade deficit with Mexico, not seasonally adjusted. June's trade deficit with Mexico was $5.935 billion.
Oil or petroleum showed an end use trade deficit of $22.536 billion, for June, a decrease of -$2.27 billion, or -9.14%, from last month, a welcome relief as prices dropped. Petroleum related end use was 39.6% of the goods trade deficit. Petroleum related imports from China as essentially non-existent.
End use means the final use of the product. For example, plastics are made up of petroleum, yet by their end use category, would be marked often as consumer goods.
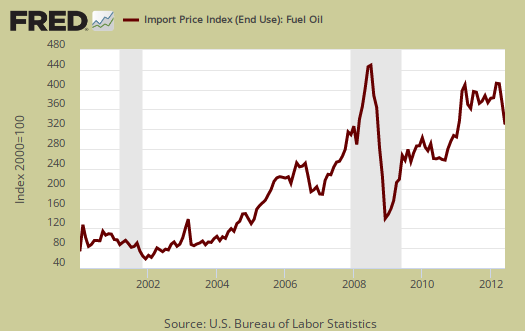
The United States basically has two major ongoing problems with the trade deficit, Chinese goods and Oil imports. Below is the not seasonally adjusted import price index for oil fuel. The average price for a barrel of oil in June was $100.13. As of this posting oil is $93/barrel. By volume, the U.S. imported 331,836 barrels of petroleum related energy products in June, pretty much the same increase as last month.
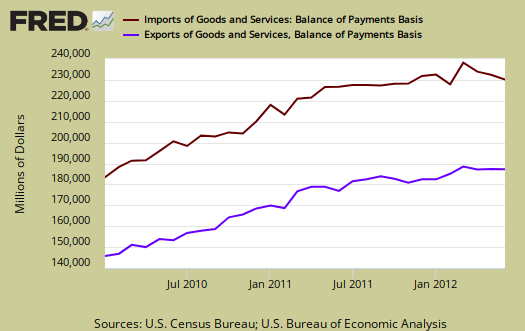
Below are imports vs. exports of goods and services. Notice how much larger imports are than exports, but also notice the growth, or rate of change between months of U.S. exports over time. To state the obvious, imports subtract from GDP and exports add.
Below is the list of good export changes from May to June, seasonally adjusted, by end use. Exports of goods increased $1.746 billion on a Census accounting basis, whereas the headline buzz is the BOP accounting method, or a $1.836 billion increase for goods exports. Exhibit 7 gives Census accounting method breakdown for exports. Soybean exports dropped by -$660 million. Industrial materials and supplies showed a $603 million monthly increase in nonmonetary gold. Here's a weird one, we exported $248 million more in gem diamonds. Pharmaceutical exports increased by $459 million and petroleum products exports increased by $508 million.
- Automotive vehicles, parts, and engines: +$0.695 billion
- Industrial supplies and materials: +$0.563 billion
- Other goods: +$0.248 billion
- Foods, feeds, and beverages: -$0.792 billion
- Capital goods: +$0.168 billion
- Consumer goods: +$0.865 billion
Below are the goods import monthly changes, seasonally adjusted. Overall imports decreased -$3.632 from last month on a Census accounting basis. The story here is oil, whose monthly change was -$2.653 billion to $27.295 billion in crude oil imports. This is a -10.77% monthly decline. Price matters.
- Industrial supplies and materials: -$2.279 billion
- Capital goods: -$1.286 billion
- Foods, feeds, and beverages: -$0.159 billion
- Automotive vehicles, parts, and engines: +$0.608 billion
- Consumer goods: -$0.569 billion
- Other goods: +$0.053 billion
Running a trade deficit in advanced technology is not a good sign for those jobs of tomorrow. The below report statistics are not seasonally adjusted.
Advanced technology products exports were $26.5 billion in June and imports were $33.7 billion, resulting in a deficit of $7.2 billion. June exports were $1.8 billion more than the $24.8 billion in May, while June imports were $0.3 billion more than the $33.4 billion in May.
Here is the breakdown with major trading partners, not seasonally adjusted. China is the worst trade deficit, as detailed above.
OPEC can be assumed to be oil and the OPEC nations are: Algeria, Angola, Ecuador, Iran, Iraq, Kuwait, Libya, Nigeria, Qatar, Saudi Arabia, United Arab Emirates, Venezuela.
The April figures show surpluses, in billions of dollars, with Hong Kong $2.6 ($2.9 for May), Australia $1.9 ($1.7), Singapore $1.2 ($1.0), and Egypt $0.1 ($0.1).
Deficits were recorded, in billions of dollars, with China $27.4 ($26.0), OPEC $8.5 ($11.2), European Union $8.4 ($10.5), Japan $6.0 ($6.4), Mexico $5.9 ($6.3), Germany $4.1 ($4.9), Ireland $2.6 ($2.7), Canada $1.5 ($2.0), Nigeria $1.4 ($1.4), Taiwan $1.2 ($1.3), Korea $1.1 ($2.0), and Venezuela $1.0 ($1.6).
Here is the BEA website for additional U.S. trade data, such as it is. May we suggest the Census make publicly available much more data so one can compare Apples to Apples, end use, NAICS and seasonally adjusted series.
You might ask what are these Census Basis versus Balance of Payment mentioned all over the place? The above mentions various accounting methods so we're comparing Apples to Apples and not mixing the fruit. The trade report in particular is difficult due to the mixing of these two accounting methods and additionally some data is seasonally adjusted and others are not. One cannot compare values from different accounting methods and have that comparison be valid.
In a nutshell, the Balance of Payments accounting method is where they make a bunch of adjustments to not count imports and exports twice, the military moving stuff around or miss some additions such as freight charges. The Census basis is more plain raw data the U.S. customs people hand over which is just the stuff crosses the border. The 2005 chain weighted stuff means it was overall modified for a price increase/decrease adjustment in order to remove inflation and deflation time variance stuff.
Bottom line, you want just the raw data of what's coming into the country and going out, it's the Census basis and additionally the details are only reported in that accounting format. Additionally the per country data is not seasonally adjusted so watch out trying to add those numbers into the overall trade deficit. It's a statistical no-no to mix seasonal and non-seasonally adjusted numbers.
Here is last month's trade deficit overview, data unrevised.
Recent comments