
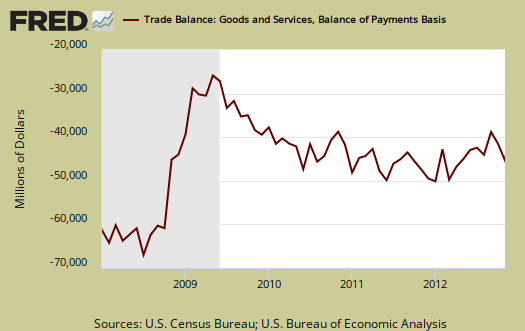
The U.S. November 2012 monthly trade deficit increased by 15.85%. This is an increase of $6.667 billion to give a monthly trade deficit of $48.731 billion. November's U.S. exports increased $1.744 billion or 0.96%. Imports soared by $8.410 billion which is a 3.8% increase from last month. The three month moving average gives a trade deficit of $43.691 billion and a increase of $2.05 billion. This is a 4.92% jump in the quarterly moving average of the trade deficit. Adjusted for prices, just the three month moving average goods part of the trade deficit by a Census accounting basis, in real dollars, gives a whopping 15.8% annualized increase. Both of these moving averages imply Q4 GDP will be lower due to the never ending flood of imports.
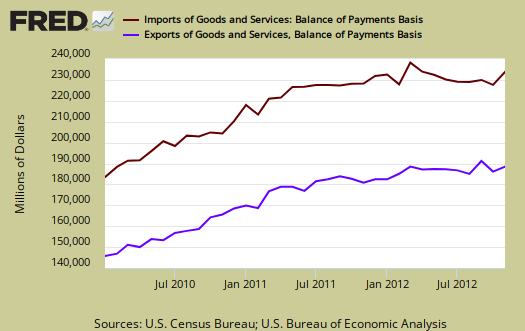
Below are imports vs. exports of goods and services. Notice how much larger imports (maroon) are than exports (purple), but also notice the growth, or rate of change between months of U.S. exports over time. To state the obvious, imports subtract from GDP and exports add and why trade deficits matter.
Below are the goods import monthly changes, seasonally adjusted. Overall imports soared $8.425 billion from last month on a Census accounting basis. Who knew one could import $8.422 billion in cell phones and other household goods in a month. Cell phones & other household goods, part of consumer goods, jumped by $1.811 billion from October. Drug imports also increased by $1.263 billion. A jump in auto parts is no surprise since bad trade deals enabled the offshore outsourcing of parts manufacturing. Industrial supplies import increases were chemicals, by $746 million and non-monetary gold, which increased by $413 million from last month.
- Industrial supplies and materials: +$1.274 billion
- Capital goods: +$0.408 billion
- Foods, feeds, and beverages: +$0.555 billion
- Automotive vehicles, parts, and engines: +$1.513 billion
- Consumer goods: +$4.552 billion
- Other goods: +$0.122 billion
Below is the list of good export monthly changes, seasonally adjusted, by end use and on a Census accounting basis. Overall exports increased by $1.797 billion.
- Automotive vehicles, parts, and engines: +$0.743 billion
- Industrial supplies and materials: +$0.577 billion
- Foods, feeds, and beverages: -$0.355 billion
- Capital goods: +$0.937 billion
- Consumer goods: +$0.065 billion
- Other goods: -$0.170 billion
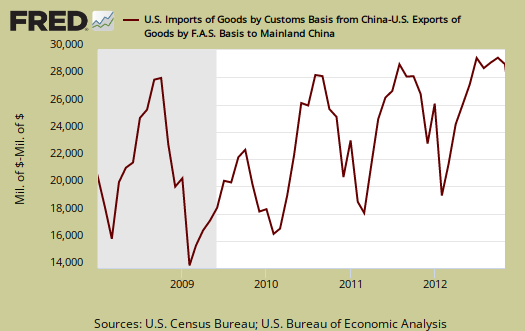
The monthly trade deficit with China was $28.954 billion. The year to date trade deficit with China is $290.6 billion, which means the United States-China trade deficit will exceed the record 2011 annual trade deficit with China and be greater than 2011's 3.7% of GDP.
The United States will have an over $300 billion trade deficit with China for 2012. The below graph shows the not seasonally adjusted trade deficit with China.
Below is another view of imports (maroon, scale on the left) against exports (blue, scale on the right). Notice the time line. Before NAFTA, 1994 we were breaking even and not running a deficit in trade. The China PNTR came into effect at the end of year 2000 and since then we are getting more trade deals passed with the claim they create jobs when America's export really is jobs. Only a global recession, as happened in 2008, can cause the massive trade deficit to shrink.
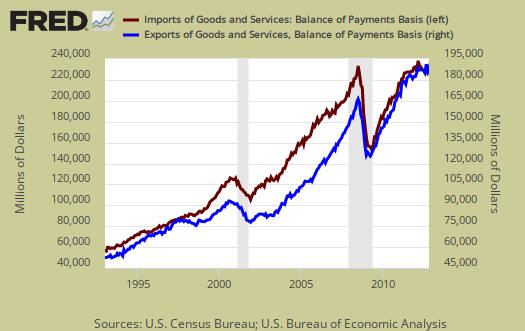
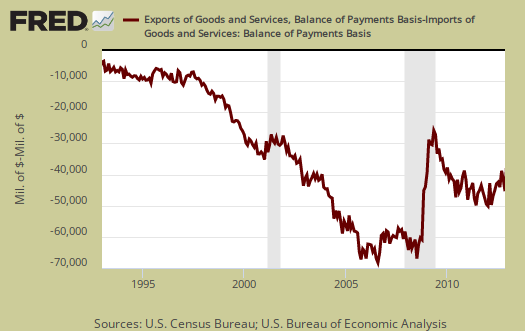
Below is another view of our trade deficit, as it grows with every trade treaty signed. The gray bars in the graph indicate recessions.
Oil or petroleum showed an end use trade deficit actually decreased for the month by $1.067 billion to $23.488 billion. Petroleum related end use was 36.2% of the November goods trade deficit and this is due to lower prices.
End use means the final use of the product and includes oil byproducts. For example, plastics are made up of petroleum, yet by their end use category, would be marked often as consumer goods.
The trade deficit in advanced technology also continues to increase. The political spin is to claim only low paying, low skilled jobs are offshore outsourced. That clearly is false and amplified by a trade area which has large numbers of advanced R&D and manufacturing jobs. The below report statistics are not seasonally adjusted.
Advanced technology products exports were $26.0 billion in November and imports were $37.8 billion, resulting in a deficit of $11.8 billion. November exports were virtually unchanged from October, while November imports were $1.7 billion more than the $36.1 billion in October.
Here is the breakdown with major trading partners, not seasonally adjusted with the parenthesis being last month's deficit figures. China is the worst trade deficit, as detailed above.
OPEC can be assumed to be oil and the OPEC nations are: Algeria, Angola, Ecuador, Iran, Iraq, Kuwait, Libya, Nigeria, Qatar, Saudi Arabia, United Arab Emirates, Venezuela. The trade deficit with Nigeria is not scams, it's oil, although considering how many financial scams originate from Nigeria, one might think so.
The October figures show surpluses, in billions of dollars, with Hong Kong $3.0 ($1.9 for October), Australia $1.8 ($1.8), Singapore $1.1 ($0.5), and Egypt $0.2 ($0.2).
Deficits were recorded, in billions of dollars, with China $29.0 ($29.5), European Union $12.2 ($10.6), OPEC $6.6 ($8.6), Germany $6.2 ($5.4), Japan $6.2 ($7.0), Mexico $4.9 ($4.4), Canada $3.0 ($1.7), Ireland $2.3 ($1.8), Venezuela $2.0 ($1.8), Korea $1.8 ($1.6), Taiwan $1.3 ($1.4), and Nigeria $1.0 ($1.8).
Here is the BEA website for additional U.S. trade data, such as it is. May we suggest the Census make publicly available much more data so one can compare Apples to Apples, end use, NAICS and seasonally adjusted series. In fact, please complain to your Congressional representatives, for the Census demands $300 dollars per year to access any detail in trade statistics. That's not cool, we already pay for detailed trade statistics with tax dollars.
You might ask what are these Census Basis versus Balance of Payment mentioned all over the place? The above mentions various accounting methods so we're comparing Apples to Apples and not mixing the fruit. The trade report in particular is difficult due to the mixing of these two accounting methods and additionally some data is seasonally adjusted and others are not. One cannot compare values from different accounting methods and have that comparison be valid.
In a nutshell, the Balance of Payments accounting method is where they make a bunch of adjustments to not count imports and exports twice, the military moving stuff around or miss some additions such as freight charges. The Census basis is more plain raw data the U.S. customs people hand over which is just the stuff crosses the border. The 2005 chain weighted stuff means it was overall modified for a price increase/decrease adjustment in order to remove inflation and deflation time variance stuff.
Bottom line, you want just the raw data of what's coming into the country and going out, it's the Census basis and additionally the details are only reported in that accounting format. Additionally the per country data is not seasonally adjusted so watch out trying to add those numbers into the overall trade deficit. It's a statistical no-no to mix seasonal and non-seasonally adjusted numbers.
Here is last month's trade deficit overview, data unrevised.
Recent comments