
There were 932,000 more people considered not in the labor force for October 2013 according to the BLS employment report. The labor participation rate plummeted to a new low of 62.8%. Happy belated Halloween America for the these are some crazy unemployment statistics that are one big scary surprise. While the month to month household survey figures vary greatly as a general rule, there is no government shutdown effect to explain away the monthly cliff dive of people no longer counted as part of the labor force this month.
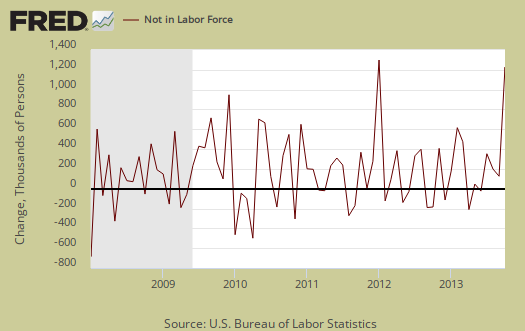
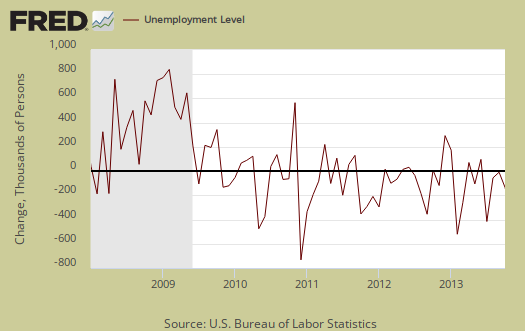
This article overviews and graphs the statistics from the Current Population Survey of the employment report and this is one funky month. Those not in the labor force now tallies to 91,541,000. The below graph is the monthly change of the not in the labor force ranks. As we can see almost a million added to the not in the labor force rolls in a month's time is not unprecedented.
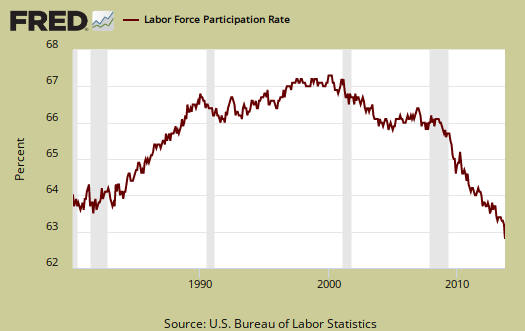
The most frightening statistic this month is the labor participation rate. The labor participation rate plunged -0.4 percentage points to 62.8%. This is the lowest labor participation rate since March 1978. The labor participation rate has declined a full percentage point from a year ago. This implies that those who were dropped from the labor force are staying out of the labor force in large numbers. The -0.4 percentage point drop represents about 986 thousand people who are not considered part of the labor force anymore. Over the past year 3.134 million people have dropped out of the labor force. That is an astounding figure. Even with the survey monthly variance, even 2 million dropping out of the labor force in a year is beyond comprehension. For those claiming the low labor participation rate is just people retired, we proved that false by analyzing labor participation rates by age, back in 2012. While we hope to update this analysis for 2013. In the interim, in the past year the the general population of those aged 55 and over, not in the military, infirm or locked up somewhere has increased by 2.2 million. In other words, the dramatic increase of those not in the labor force cannot be everyone retiring who is age 55 and over.
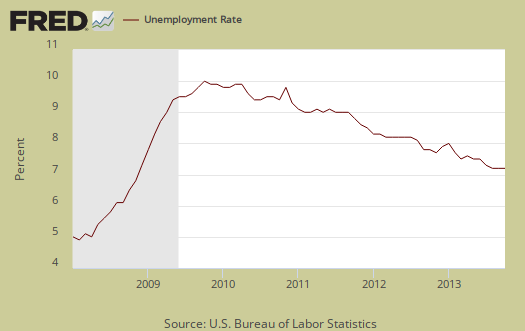
The unemployment rate ticked up a tenth of a percentage point to 7.3%, which statistically isn't significant. There could be a problem with furloughed Federal workers being misclassified as unemployed potentially, yet due to seasonal adjustments, it is statistically impossible to separate out the temporary impact on the official unemployment rate, graphed below. The BLS has done their best to explain the shutdown impact, both here and here (pdf) and unfortunately potential skew in this month's figures cannot be quantified. We're going to do the overviews, as is, but for the unemployed, employed levels take this month with a grain of salt, unlike some of the statistics, such as labor participation rate and not in the labor force. Those statistics have little to do with a potential misclassification of furloughed federal workers, although the ripple effects of the shutdown into the general employment situation might be appearing.
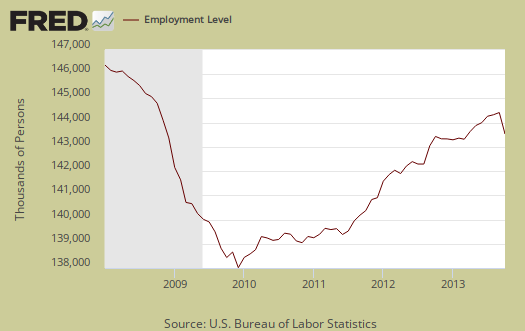
The number of employed people now numbers 143,568,000, a -735,000 monthly decline, well outside the margin of error. Since the BLS states Federal workers were classified as unemployed on temporary layoff Yet the huge drop doesn't quite add up for Federal workers misclassified were also counted as employed One is counted as employed, even if temporarily absent from work during the CPS survey week. From the BLS:
Although federal workers who did not work during the reference week due to the shutdown should have been classified as unemployed on temporary layoff, it appears that some workers were included in the measure of employed persons with a job but not at work.
In October, there were 307,000 federal workers classified as employed with a job but not at work during the survey reference week (not seasonally adjusted). This is much larger (roughly 200,000 larger) than the number with a job not at work in prior months and years and reflects the impact of the October 2013 shutdown.
Below is a graph of the Current Population Survey employed and frankly we cannot ascertain why the huge drop for the month of October, so take it with a grain of salt.
Those unemployed stands at 11,272,000, a 17 thousand increase from last month. Below is the change in unemployed and as we can see, this number also swings wildly on a month to month basis. Temporary unemployment of Federal workers clearly went into the unemployment levels for October. While to be counted as unemployed, one must have looked for work in the past month, those on temporary layoff do not have this requirement to be counted as unemployed. Not seasonally adjusted federal workers on temporary layoff jumped up by 200,000 in October.
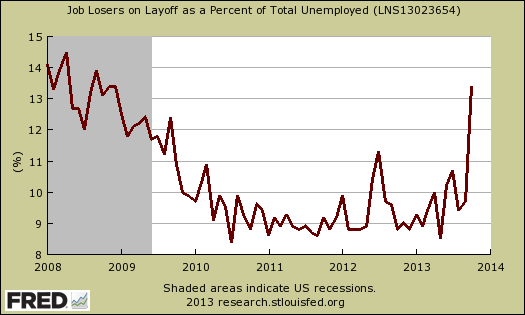
To see how much the shutdown skewed the ranks of the unemployed statistics, all we need to do is look at those laid off as a percentage of the unemployed. Look at this spike. Thanks shutdown for messing up our true unemployment picture! We do not know the actual amount of just Federal workers in the below graph as well, for Federal worker statistics are not seasonally adjusted whereas the below graph is all who were laid off, and is seasonally adjusted.
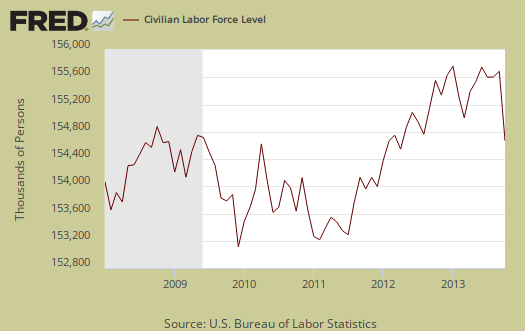
The civilian labor force, which consists of the employed and the officially unemployed, is now at 154,839,000, a -720,000 decline from last month. The dramatic drop in the civilian labor force is due to the employed levels sharply dropping for the month. The problem here is federal workers should have been counted as employed, but absent from work or unemployed. It would be doubtful shutdown slammed federal workers would have been categorized as not in the labor force, so the reality is either we do massive analysis on not seasonally adjusted data or...we wait until next month to see what shakes out on the household survey. We'll vote for the latter, although here too we see wild swings in the size of the civilian labor force are not unprecedented.
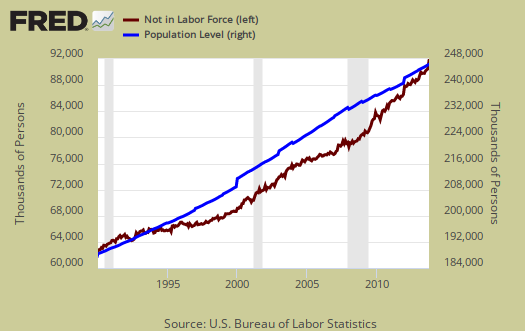
In spite of the wild swings, as a slope, or rate of increase, those not in the labor force grows faster than the population that has the potential to work. Below is a graph of those not in the labor force, (maroon, scale on the left), against the noninstitutional civilian population (blue, scale on the right). Notice how those not in the labor force crosses the noninstitutional civilian population in growth and the accelerated growth started happening right in 2008. This cannot possibly be retirees, all at once, in spite of the baby boom, there simply were not that many babies born in 1943 to explain the step increase starting with the recession.
Below is a graph of the civilian labor force, or the official employed plus unemployed, in maroon, scale on left, against those not in the labor force, in blue, scale on right. Notice how those not in the labor force as a trend exceeded those considered employed and unemployed starting around mid 2009. It is only recently, in the past few months, where we see the reverse by trend lines, where the slopes implying growth rates are more matching. What we have seen is a never ending growing segment of the population that is considered neither employed or unemployed, i.e. not in the labor force, increasing, above the trend line of those who would be naturally dropping out, such as the retired and those in school. Not in the labor force figures do include retirees.

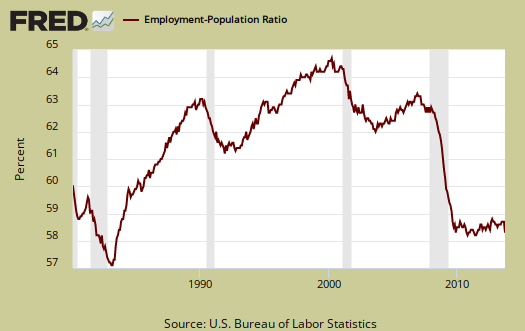
Those considered employed as a ratio to the total Civilian noninstitutional population absolutely plunged as well, by -0.3 percentage points to stand at 58.3%.. This ratio has been hovering around 1983 record lows for years now and in 1983 there were more families with a stay at home mom, with wages high enough for only one adult to work and support a family. The low ratio implies there are many people who could be part of the labor force are not anymore, as shown in the graph below.
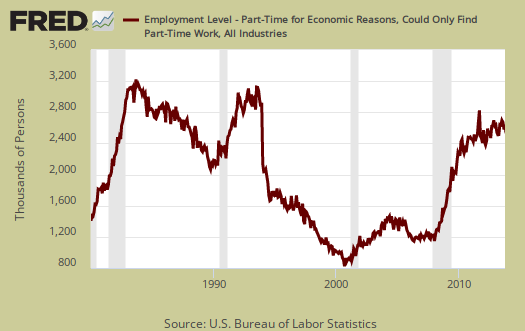
Federal workers working part-time due to the shut down was pretty much the same as in past Octobers so it appears the shutdown didn't impact the part-time employment statistics much.. Working part-time has grown generally. There are millions of people who need full-time jobs with benefits who can't get decent career oriented positions. Those forced into part time work is now 8,050,000, an increase of 124,000 from last month. Those stuck in part-time has declined by -236 thousand from a year ago, While the decline might seem like a recent improvement, it's not. The below graph shows levels of people who could only get part time hours have remained elevated since the recession.

There are two categories of those working part-time hours. Those who could only get part-time jobs and those working who got their hours cut due to businesses not having enough work for them. The number of people who could only get part-time work increased by 42 thousand to 2,599,000. The number of people who could only find part-time work has been fairly static and high as shown in the below graph.
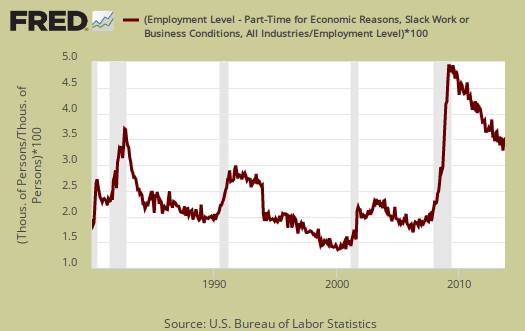
Stuck in part-time hours due to slack working conditions is another story. This figure has remained just obscenely high for years now and currently numbers 5,047,000 people Below is a graph of forced into part-time work because they got their hours cut, as a percentage of the total employed. Part-time work due to cut hours is known as slack work conditions and increased 87,000 from last month. Slack working conditions causing part-time hours still amazingly high, and implies economic conditions have not improved enough, that there still is just not enough demand in the economy for businesses to run full steam. Below is a graph of forced part-timers due to slack work conditions as a percentage of the civilian labor force. This is a recession economic indicator. Notice the line slope matches strongly the gray recession bars of the graph.
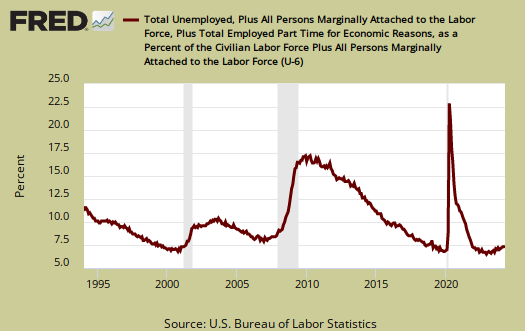
U-6 is a broader measure of unemployment and includes the official unemployed, people working part-time hours because that's all they can get and a subgroup not counted in the labor force but are available for work and looked in the last 12 months. Believe this or not, the U-6 alternative unemployment rate still leaves out some people wanting a job who are not considered part of the labor force. U-6 increased 0.2 percentage points to 13.8%. This month's increase is the official unemployment rate as well as the increase in forced part-time hours.
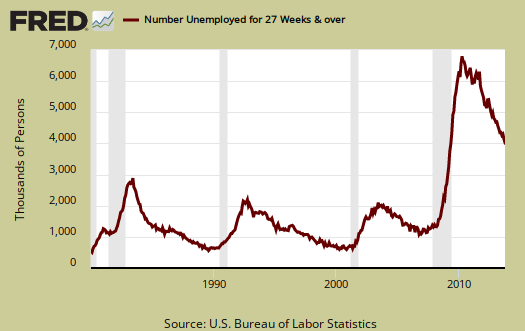
The long term unemployed, or those unemployed for 27 weeks and over, stands at 4,063,000 people. This is an decline of -83,000 from last month. The long term unemployed are the crisis of our time and this figure decrease does not necessarily imply those unemployed for a long time are actually finding jobs.
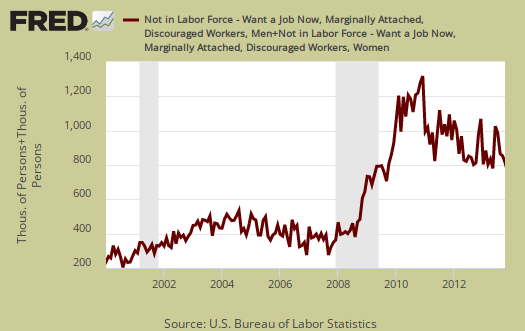
The marginally attached are people not in the labor force because they have not looked for a job in the last month, but have looked for a job in the last year. This number has ballooned since 2007 and not returned to pre-recession levels. The graph below is the number of people considered marginally attached to the labor force, currently at 2,283 million.

Discouraged workers are people, not counted as part of the civilian labor force, who not only want a job, but also looked for one in the last year. These people aren't job hunting now because they believe there are no jobs out there. Below is the graph of discouraged workers, currently at 815,000 people and are a subset of the marginally attached. Discouraged workers is kind of a barometer for how the job market is perceived and has is pretty much unchanged from a year ago.
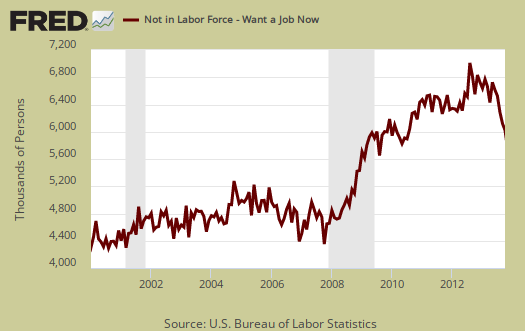
Our favorite statistic from the CPS survey is how many people who are considered not in the labor force, report they want a job now. It is a direct survey question from the CPS. The survey asks people who are not being counted in the unemployment statistics and official unemployment rate if they want a job. The number who answer yes currently stands at 6,162,000. There are an astounding number of people not counted who report they actually want a job and around 1.5 million higher than before the recession. This figure includes the discouraged workers and marginally attached and is seasonally adjusted.
The average length of unemployment is now 36.1 weeks The average duration is so high due to the long-term unemployed who represent36.1% of the unemployed. This month's decline is due to a sudden influx in the newly unemployed, lowering the average duration. Many face age discrimination as well as discrimination for the fact they need a job, one of the worst injustices in America.

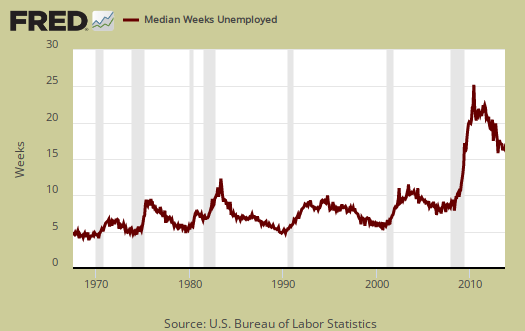
The median time one is unemployed, which means 50% of people have gotten a job in this amount of time, and is 16.3 weeks and also did not change from last month. This is over four months to be without a paycheck as the median, it's quite high.
Those unemployed less than five weeks saw a 165 thousand increase from last month. Those unemployed between five weeks and 14 weeks decreased by -47 thousand and people who had been unemployed for 14 weeks to 26 weeks declined by -22,000. As previously noted, the long term unemployed decreased by -83 thousand. . A drop in the unemployed does not necessarily mean they found a job.
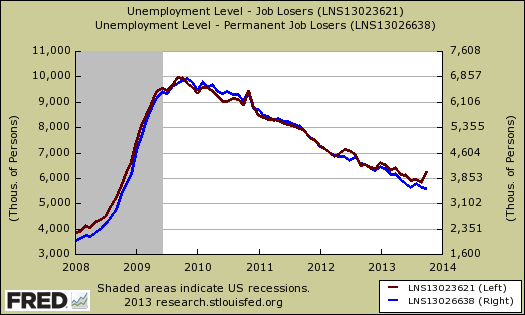
Another crazy figure from this month's household survey is the reason for new unemployment status. Job losers and those who completely temporary jobs just ballooned by 409,000 to 6,253,000. Yet a couple of facts. First, this is not unprecedented on a monthly figure for the CPS, although it hasn't happened since September of last year, when the ranks of the job losers cliff dove by -446 thousand. Second we know some of these 409,000 were due to the government shutdown due to the divergence of permanent job losers from the overall figure. The graph below shows job losers in maroon, scale on the left against permanent job losers, in blue, scale on the right. We see a huge divergence this month and we can compare these two figures for they are both seasonally adjusted. Permanent job losers declined by 13 thousand, which implies once again the unemployed level gains this month appear to be mostly shutdown related. Unfortunately we are still looking at needles in a haystack and cannot comment further to say what is a monthly anomaly and what is not.
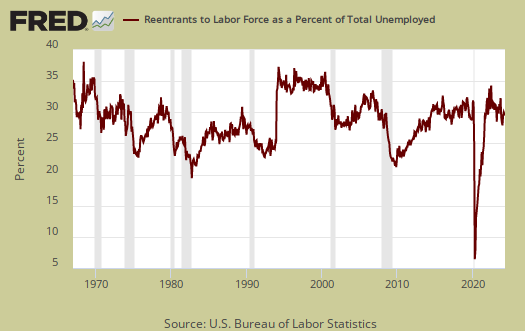
People join the ranks of the unemployed because they were laid-off, fired, they quit, the job was temporary and thus ended, they entered the labor force for the first time and re-entrants. Re-entrants are people with work experience, yet have been considered not in the labor force for some time. Recall to be considered unemployed one has to be actively searching for a job or expecting to be recalled and on temporary layoff. Re-entrants decreased by -64 thousand people this month. Below are re-entrants as a percentage of the total unemployed. As you can see, as jobs and opportunities appear, people re-enter the labor force looking to snap one of those jobs. Considering the massive damage still to the U.S. job market, the below tells us things really have not improved enough. If there were really a lot of job opportunities out there, the slope of this graph would spike up and should spike up to the extremes since there are so many who have stopped looking, are not counted as unemployed currently.
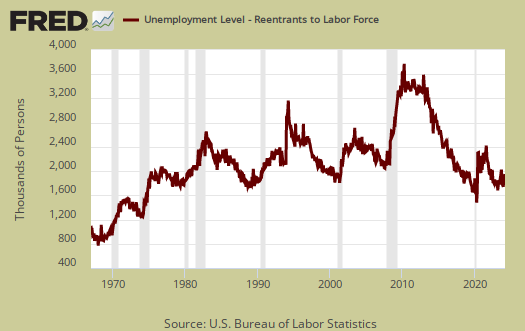
If one looks at the levels of re-entrants, or people considered not in the labor force who started actively looking for a job again, the levels are at all time highs. This is yet another sign on how people are not finding work, giving up, then dropping out of the labor force and then trying again to get a job. If the job market was good, we would see the levels of re-entrants start to decline by now, as they would have found work instead of being once again officially counted as unemployed.
To sum up this month's household survey, we believe it is possible some Federal workers were misclassified as neither employed or unemployed, due to incorrectly answering the survey questions. That said, we also believe the dramatic decline in the labor participation rate and the huge jump in those not in the labor force is in part real. Only time will tell what shakes out of this report and as a trend, we're going to have to wait until next month at least to see what shakes out. At minimum we can see shutdowns are really horrific for accurate government statistics.
Here is our overview of last month's CPS unemployment statistics.
graphs equal trend
Folks, we are the only site which throws together so many graphs per article. The reason you see so many graphs with text surrounding each one is to illustrate the trend. On most economic reports, but especially the labor market ones, the most important aspect of them is the trend over time. It is not the headline buzz numbers or the count of jobs, for those are almost always revised and job growth is still close to the error margin.
So, I hope all pay attention to the eye candy first and foremost on these overviews as I conclude the trend, overall in employment statistics really is not good. Don't get wrapped up in the monthly change or the headline buzz.