
The Consumer Price Index increased 0.3% for December as the price of gas increased 3.1% and the cost of housing oneself is on the rise. CPI measures inflation, or price increases. This is the highest monthly increase in six months, yet for the year inflation is low. Overall energy costs increased 2.1% in December where price increases are needed least.
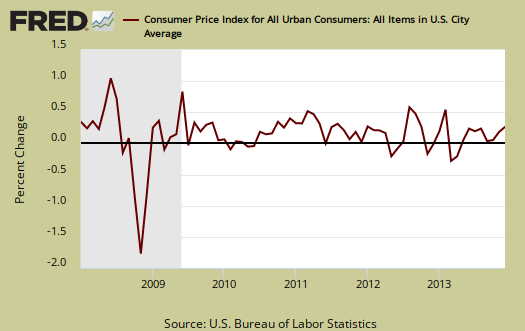
CPI has only increased 1.5% from a year ago as shown in the below graph. This is a low annual rate of inflation and believe this or not, deflation can really harm an economy. Taking together 2013's 1.5% and 2012's 1.7% annual inflation rate, this is the lowest two years in a row annual inflation increase since 1997-1998. The year 2013 by itself is much lower than the last 2.4% ten year inflation average as well.

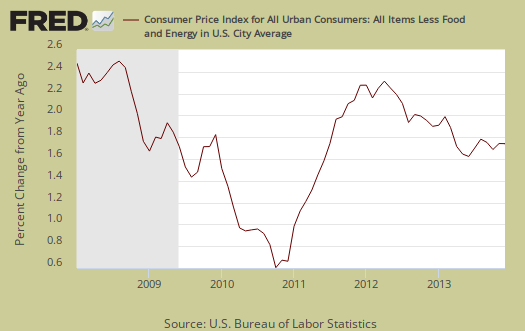
Core inflation, or CPI with all food and energy items removed from the index, increased 0.1%. Core inflation has risen 1.7% for the last year. Since June 2011 core inflation has ranged from 1.6% to 2.3% and the ten year average is 2.0% core inflation . Core CPI is one of the Federal Reserve inflation watch numbers and 2.0% per year is their target. Graphed below is the core inflation change from a year ago and here the deflationary bad juju of the recession is clearly displayed.
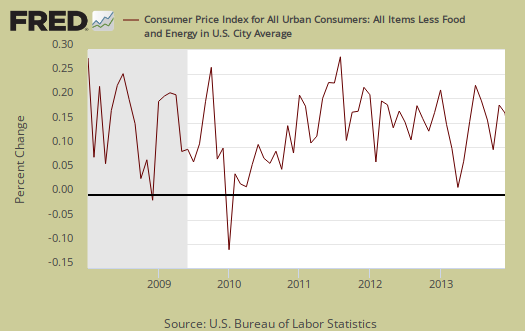
Core CPI's monthly percentage change is graphed below.
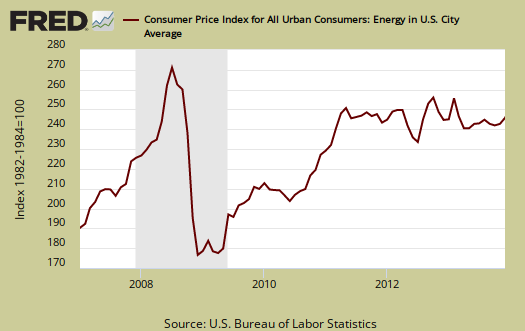
Energy overall shot up by 2.1%, yet energy costs are still low, up 0.5% for the year. This is very low in comparison to the 5.9% ten year average energy inflation rate and this is with 2012 also having an annual 0.5% energy inflation rate. The BLS separates out all energy costs and puts them together into one index. This index includes gasoline which dropped increased 3.1% for the month and has declined -1.0% for the entire year. Electricity has increased 0.4% for the month and 3.2% for the year. Fuel oil is still down -1.8% from a year ago yet for December shot up by 2.4%. Natural gas is now down -1.0% from a year ago after a monthly decline of -0.4%. Energy costs are also mixed in with other indexes, such as heating oil for the housing index and gas for the transportation index. Below is the overall CPI energy index, or all things energy. Note the speculative bubble of 2008, something the economy assuredly does not need to see again.
Graphed below is the CPI gasoline index only, which shows the volatility of gas prices. This isn't the first time, nor will it be the last, where the monthly inflation numbers move dramatically on gas prices and what percentage this is of the monthly budget varies widely among consumers.

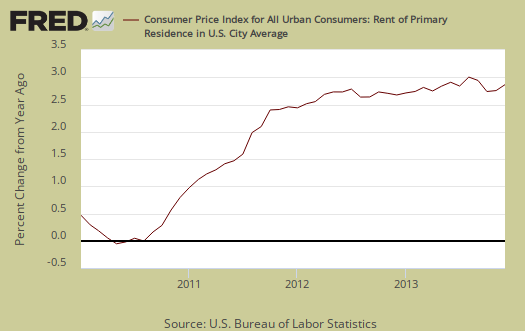
Core inflation's components include shelter, transportation, medical care and anything not food or energy. The shelter index is comprised of rent, the equivalent cost of owning a home, hotels and motels. Shelter increased 0.2% and is up 2.5% for the year. This is the highest monthly shelter inflation increase since July 2011. Rent increased 0.3%, and the cost for home owners increased 0.2%l. Hotels and Motels, known as lodging away from home is yo-yo on a month to month basis, down -0.3% for the month. Graphed below is rent, where cost increases hits the people who can least afford it.
A core inflation cost which almost never drops is medical care, yet something is going on with overall prices Medical care was unchanged this month, the 3rd month in a row, and this is while medical services, which are hospital and Doctor visits, increased 0.3% for the month and 2.5% for the year. The Medical care index has increased 2.0% over the last 12 months. This is the lowest annual increase since 1949. Graphed below is the overall medical care index change from a year ago.

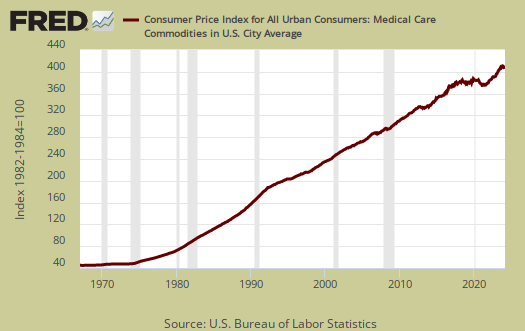
Below is a graph of the medical commodities index, which in large part consists of prescription drug prices. The index dropped -0.8% for this month with prescription drugs by themselves declining -0.9%. Notice the beyond belief never ending increases since 1975. While the drop in drug prices is great news, the massively overinflated prescription drug prices need to come down a lot to be in line with what other nations pay. Medical commodities have still increased 0.3% for the year.
Food and beverages overall increased 0.1% and have increased 1.1% from a year ago. Beyond the 2009 deflationary period, this is the lowest annual food inflation since 1976. The food at home index, i.e. groceries, had no change for the month. Food for home is now only up 0.4% for the year.. Eating out, or food away from home increased 0.1% from last month and is up 2.1% from a year ago. Graphed below is the overall food index.

Graphed below is the food at home index. CPI does numerous substitutions on food, where if the price of steak increases, they claim hamburger is equivalent. Substitutions in part explain why you see $7 for some crappy frozen take out at the grocery, yet the food index rise appears relatively tame. That said it does appear overall food inflation is low.

While inflation is tame, shelter is on the rise and this is 31.8% of monthly expenditures. Shelter overall increased 2.5% for 2013 while rents are up 2.9%. Additionally the BLS released real hourly earnings for December. The hourly real wage decreased -0.3% for the month and weekly earnings had no change for the year due to less hours. This means wages are not keeping up with inflation and this is when inflation is at extreme lows.
CPI details
The DOL/BLS does take yearly surveys on where the money goes in the monthly budget, but as one can see, food and energy are significant amounts of the monthly finances. Run away costs in these two areas can break the bank, so can food. Additionally CPI uses substitution, so if flour goes through the roof, somehow we're all just fine with oats and prices didn't really overall increase much. Here is the BLS CPI site, where one can find much more details, information on calculation methods and error margins.
Other CPI report overviews, unrevised, although most graphs are updated, are here. If you're wondering why the graphs display different figures from the text, the graphs calculate percentages from the index and do not round. The actual data from the BLS report does round to one decimal place. In other words, 0.05% is rounded to 0.1%.
energy commodities
gasoline prices were 3.1% higher & fuel oil was up 2.4%...however, that category, energy commodities, was listed as up 3.4%...i dont see where they got that, unless they're saying kerosene and firewood drove the energy commodity index up
rjs
Commodities vs. Index
Commodities are finished goods ready for sale. Indexes are what was actually purchased.
So, in other words, energy commodities being higher means we're going to see higher energy purchase prices soon.
It's the stage of production, so commodities are the very final stage being priced for sale, but not actually purchased by consumers.
I believe this is the difference you can correct if you find out otherwise.