
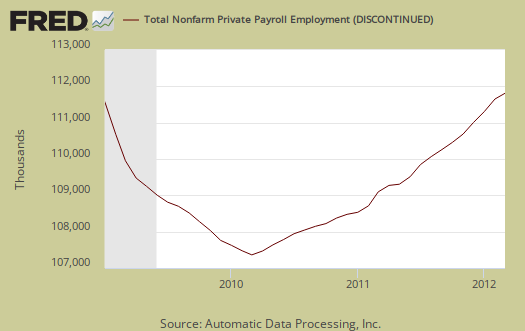
ADP, released their proprietary private payrolls jobs report. This month ADP is reporting a gain of 209,000 private sector jobs in March. February 2012 was revised up by 14,000, from 216,000 to 230,000. January was also revised, from 173,000 to 182,000. In contrast, the BLS reported 233,000 private sector jobs for February 2012. Graphed below are the reported private sector jobs from ADP. This report does not include government, or public jobs. Yes, the graph does look like a smiley face, although one that had a stroke from 2009 onward. Still, a smiling graph shape is a very positive sign.
ADP's numbers claim the service sector created 164,000 jobs while the goods sector gained 45,000 jobs. ADP's private service sector jobs for February were revised upward to 183,000. Manufacturing for March increased by 23,000 jobs for the month. ADP's financial services jobs increased by 8,000 jobs and construction private jobs increased by 13,000.
This report, if it matches Friday's official unemployment report, would overall imply another real growth for jobs. Odds on there will be more government jobs, public sector job losses. The United States needs at least 90,000 jobs created each month just to keep up with population growth.
ADP captures jobs by business size and this is worth looking at, especially due to it's relativity within the same report (and methods). In March:
Employment on large payrolls—those with 500 or more workers—increased 22,000, and employment on medium payrolls—those with 50 to 499 workers—rose 87,000 in March. Employment on small payrolls—those with up to 49 workers—rose 100,000 that same period. Of the 87,000 jobs created by medium-sized businesses, 21,000 jobs were created by the goods-producing sector and 66,000 jobs were created by the service-providing sector.
Below is the graph of ADP private sector job creation breakdown of large businesses (bright red), median business (blue) and small business (dark red). For large business jobs, the scale is on the right of the graph. Medium and Small businesses' scale is on the left.
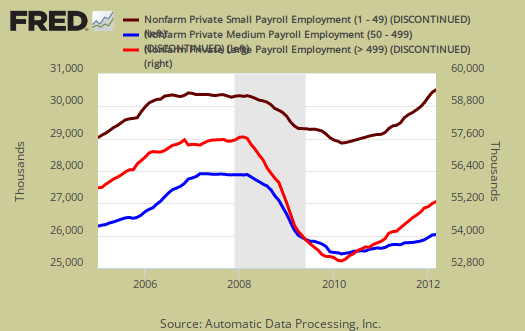
While this month is another improvement, generally, large business, who lobby Congress for their bad trade deals, more offshore outsourcing through foreign guest worker importation and labor arbitrage, are almost absent from job creation in terms of hiring Americans. Notice how large businesses cliff dove in 2008, shedding employees, and have not returned at all to pre-recession employment levels. This pattern actually starts just about the time offshore outsourcing and the China PNTR came into effect, year 2000. Small businesses, on the other hand, have increased employment. May I suggest that small businesses are not international, they are not signing offshore outsourcing contracts and moving jobs to India and China. Multinationals, on the other hand, the below decade trend line clearly shows these so called U.S. corporations have abandoned the U.S. worker, on whole.
There is a historic strong mismatch between ADP and the BLS jobs report, although recently the two are converging again recently. To date, the number of private nonfarm payroll jobs ADP reports versus what the BLS reports and on a month-to-month and even cumulative basis do not match. This monthly error is often large, especially when looking at small job growth overall (< 400,000 jobs per month) on a month to month basis. The monthly BLS jobs survey (CES) has a 100,000 payroll jobs overall margin of error.
Below is the cumulative difference between what the ADP reports as the private nonfarm payroll jobs vs. the BLS (ADP minus BLS). This line shows the divergence, over time in number of nonfarm private payroll jobs reported between the two reports. The difference seems to be stabilizing around 400,000. This article is updated with the February BLS payrolls data.
While ADP notes a simple correlation of 0.95, well, a 5% error between monthly reported jobs numbers is an average, and we can see on some months the differences are quite large and around 2008, the difference started to hit about 900,000 jobs. That said, the reported job growth is so piss pour, statistically we're rolling around in the margin of error each month.
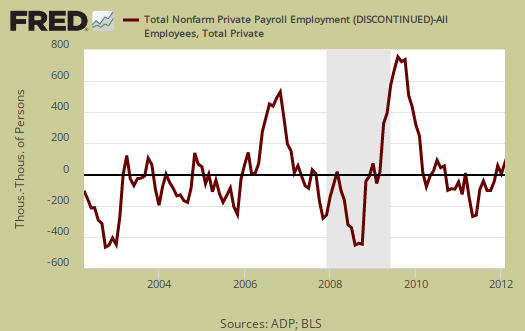
ADP does use the same seasonal adjustment as the BLS, but their other methodology and even sampling size are different, proprietary. That said, ADP has now put up some details of their methodology to explain the statistical differences between their estimate, the actual mathematics, vs. the BLS. This is new, and good ADP is disclosing their entire methodology so we may get more apples to apples comparisons of the two reports. The graph below is the monthly change of private jobs as reported by ADP.

Regardless of the statistical differences between ADP and the BLS, this indicates a continuing return to mediocre job growth. Sorry folks, 200k job growth numbers does not mean the Gods are now shining upon us. More we're all simply used to seeing beyond belief, pathetic job growth numbers. We still have estimated 28 million people needing a job. Four Hundred thousand monthly job growth, on the other hand, would be something to sing hallelujah over.
Here is the February 2012 ADP private sector jobs report overview, only graphs revised.
Recent comments