
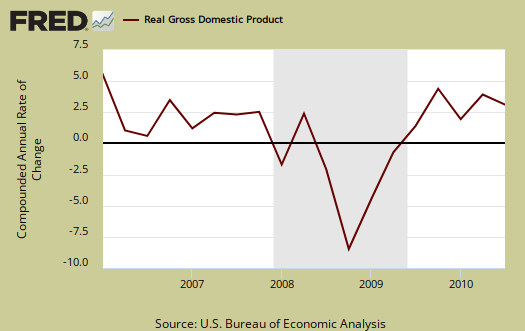
Q3 GDP 2010 was revised upward to 2.5% from 2.0%, a significant revision for gross domestic product. Real final sales, a measure of real demand in the economy, was 1.2%. Here is the actual report and here is the BEA press release.
As a reminder, GDP is made up of:
where
Y=GDP, C=Consumption, I=Investment, G=Government Spending, (X-M)=Net Exports, X=Exports, M=Imports.
Here is the Q3 2010 second revision breakdown of GDP percentage points:
- C = +1.97
- I = +1.51
- G = +0.81
- X = +0.77
- M = –2.52
Here is the Q3 2010 advance report breakdown of GDP percentage points:
- C = +1.79
- I = +1.54
- G = +0.68
- X = +0.61
- M = –2.61
Below are the percentage point differences between the advance and revised GDP report components:
- C = +0.18
- I = -0.03
- G = +0.13
- X = +0.16
- M = +0.09
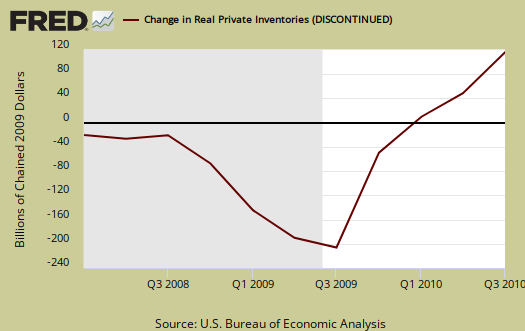
Changes in inventories were revised considerably by -0.14 percentage points, to 1.30. Of the total 2.5% or minus inventory changes, Q2 2010 GDP would have been 1.2%, so this revision implies we had growth beyond just inventory changes. Nonresidential fixed investment was +0.96, yet residential was -0.75, and why fixed investment only contributed 0.20 of the 2.5% GDP change.
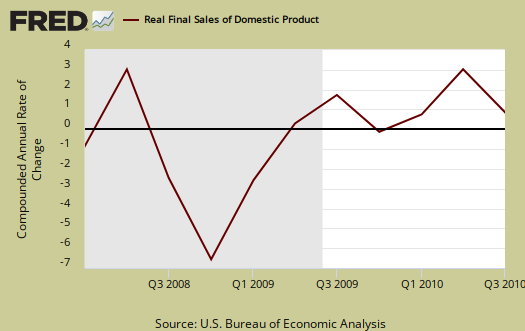
Below are real final sales of domestic product, or GDP - inventories change. This gives a better feel for real demand in the economy. Still Limp, but this revision gives huge improvement, over a doubling of real final sales from the Q3 2010 advance report.
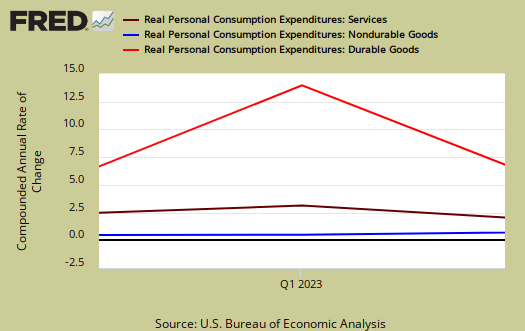
Below the the St. Louis FRED graph for C, or real personal consumption expenditures of the above GDP equation. PCE was revised upward and is the largest component of GDP.

Below is the breakdown in C or real PCE annualized change. Notice when times are tough, durable goods (bright red) consumption drops. This quarter was an increase in services, a 1.16 percentage point contribution to GDP.
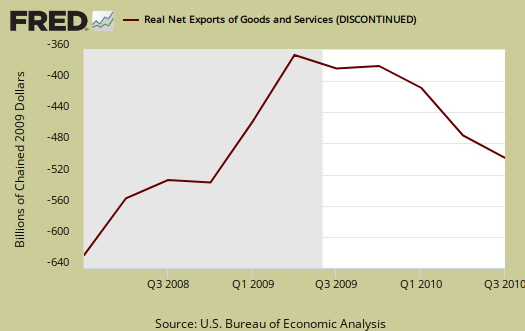
Imports literally wipes out GDP growth. While imports improved (by declining further), and thus the trade deficit revision added a 0.25 to Q3 GDP, it's percentage contribution still literally wipes out GDP annualized growth totals, GDP - M is 2.53%-2.52% and this is equals nada. The trade deficit now contributes -1.75 of the total 2.5% Q3 2010 GDP.
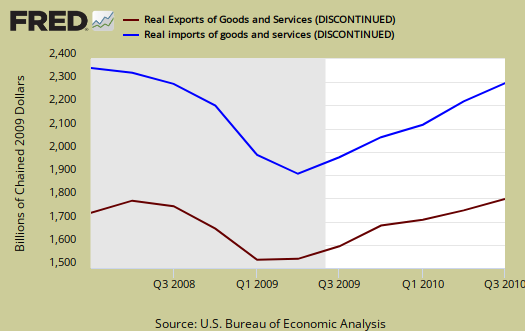
The below graph is real imports vs. exports. While exports increased, it is the trade deficit that matters. We can see imports decreased, it's still a major drag on the economy.
Below are the percentage changes of GDP components in comparison to the revised second quarter of 2010:
- C = +2.8%, revised 0.2%
- I = +12.4%, revised -0.4%
- G = +4.0%, revised +0.6%
- X = +6.3%, revised 1.3%
- M = +16.8%, revised -0.6%
The BEA's comparisons in percentage change breakdown from Q2 2010 are below. Notice the decline in residential investment.
C: Real personal consumption expenditures increased 2.8% in the Q3, compared with an increase of 2.2% in the second. Real nonresidential fixed investment increased 10.3%, compared with an increase of 17.2%. Nonresidential structures decreased 5.7%, compared with a decrease of 0.5%. Equipment and software increased 16.8%, compared with an increase of 24.8%. Real residential fixed investment decreased 27.5%, in contrast to an increase of 25.7%.
I: Real nonresidential fixed investment increased 10.3%, compared with an increase of 17.2%. Nonresidential structures decreased 5.7%, compared with a decrease of 0.5%. Equipment and software increased 16.8%, compared with an increase of 24.8%. Real residential fixed investment decreased 27.5%, in contrast to an increase of 25.7%.
X & M: Real exports of goods and services increased 6.3% in the third quarter, compared with an increase of 9.1% in Q2. Real imports of goods and services increased 16.8%, compared with an increase of 33.5%.
G: Real federal government consumption expenditures and gross investment increased 8.9% in Q3, compared with an increase of 9.1% in the second. National defense increased 8.5%, compared with an increase of 7.4%. Nondefense increased 9.5%, compared with an increase of 12.8%. Real state and local government consumption expenditures and gross investment increased 0.8% (note the advance report had a decrease of -0.2%) compared to an increase of 0.6%.
The BEA reports Motor Vehicles were 0.56, a revision increase of 0.14, percentage points of GDP and Computers were 0.27 percentage points. Structures were a -0.15 percentage points of Q3 2010 GDP contribution, revised down -0.5 percentage points and a decrease of -5.7% from Q2, a revision of +0.38 percentage points. Computers and software were a 1.11 percentage point contribution to Q3 2010 GDP.
On Gross National Product there was a decrease in net income receipts:
Real gross national product -- the goods and services produced by the labor and property supplied by U.S. residents -- increased 2.3 percent in the third quarter, compared with an increase of 1.8 percent in the second. GNP includes, and GDP excludes, net receipts of income from the rest of the world, which decreased $5.4 billion in the third quarter after increasing $3.7 billion in the second; in the third quarter, receipts increased $7.7 billion, and payments increased $13.1 billion.
Here are the graphs from Q3 2010 GDP, advance report.
Subject Meta:
Forum Categories:
| Attachment | Size |
|---|---|
| 168.2 KB |
Recent comments