
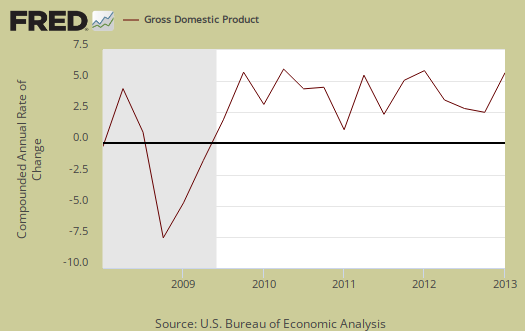
Q1 2013 real GDP was revised downward slightly to 2.4% from 2.5%. This is still an improvement, from the fourth quarter 0.4% GDP showing a stagnant economy. Consumer spending was the biggest improvement while increased imports posed a major economic drag. Government spending declines continue to be an economic damper. The revision shows more consumer spending than originally reported, less investment, less imports, less exports and government expenditures were less than previously estimated. Generally speaking a 2.4% GDP implies moderate economic growth, yet overall real demand in the economy is still fairly weak.

As a reminder, GDP is made up of: where Y=GDP, C=Consumption, I=Investment, G=Government Spending, (X-M)=Net Exports, X=Exports, M=Imports*.
The below table shows the percentage point spread breakdown from Q4 to Q1 GDP major components. GDP percentage point component contributions are calculated individually.
| Comparison of Q1 2013 and Q4 2012 GDP Components | |||
|---|---|---|---|
|
Component |
Q1 2013 |
Q4 2012 |
Spread |
| GDP | +2.38 | +0.37 | +2.01 |
| C | +2.40 | +1.28 | +1.12 |
| I | +1.16 | +0.17 | +0.99 |
| G | –0.97 | –1.41 | +0.44 |
| X | +0.11 | –0.40 | +0.51 |
| M | –0.32 | +0.73 | -1.05 |
| Comparison of Q1 2013 Component Revisions | |||
|---|---|---|---|
|
Component |
Q1 2013 Advance |
Q1 2013 Revised |
Spread |
| GDP | +2.50 | +2.38 | -0.12 |
| C | +2.24 | +2.40 | +0.16 |
| I | +1.56 | +1.16 | -0.40 |
| G | –0.80 | –0.97 | -0.17 |
| X | +0.40 | +0.11 | -0.29 |
| M | –0.90 | –0.32 | +0.58 |
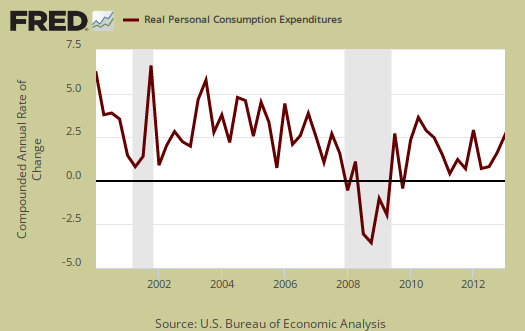
Consumer spending, C in our GDP equation, shows an increase from Q4. In terms of percentage changes, real consumer spending increased 3.4% in Q1 in comparison to a 1.8% increase in Q4. Services drove consumer spending with a 1.42 percentage point contribution in household consumption expenditures. Goods consumer spending contributed 0.98 percentage points to personal consumption expenditures. Below is a percentage change graph in real consumer spending going back to 2000.
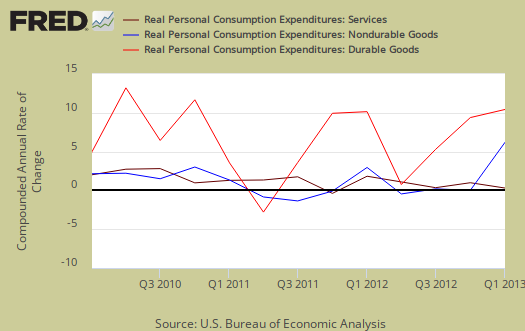
Graphed below is PCE with the quarterly annualized percentage change breakdown of durable goods (red or bright red), nondurable goods (blue) versus services (maroon).
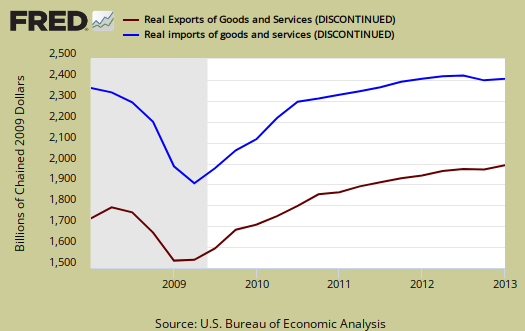
Imports and Exports, M & X subtracted -0.21 percentage points to Q1 GDP as imports increased from Q4 . Import services, which includes offshore outsourcing, were -0.16 percentage points of the -0.32 percentage point GDP reduction caused by imports. The below graph shows real imports vs. exports in billions. The break down of the GDP percentage change to point contributions gives a clear picture on how much the trade deficit stunts U.S. economic growth.
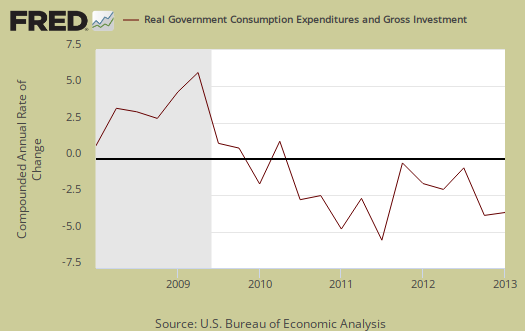
Government spending, G was –0.97 percentage points of Q1's GDP. For the second quarter in a row, there were national defense spending declines, with another –12.1% drop for Q1, a –0.63 percentage point contribution. State and local governments subtracted –0.29 percentage points from Q1 GDP. Below is the percentage quarterly change of government spending, adjusted for prices, annualized.
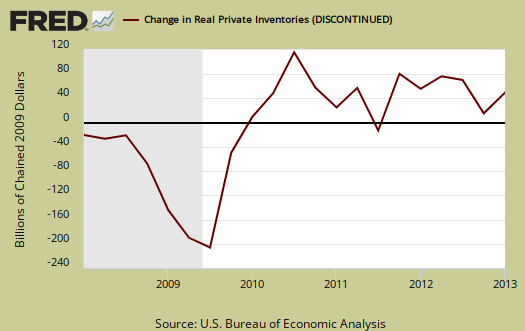
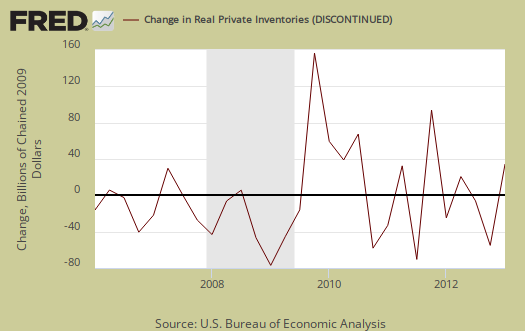
Investment, I is made up of fixed investment and changes to private inventories. The change in private inventories alone gave a +0.63 percentage point contribution to Q1, with farm inventories contributing +0.84 percentage points of the change in private inventories. Business inventories were a negative -0,21 percentage point GDP contribution. Farm inventories saved the Q1 GDP day. Below are the change in real private inventories and the next graph is the change in that value from the previous quarter.
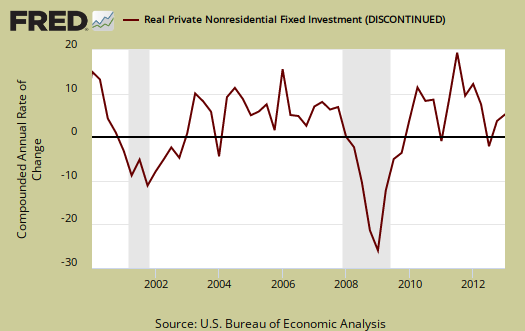
Fixed investment is residential and nonresidential and is a bright spot in the Q1 GDP report, as it was in Q4. Overall, fixed investment contributed +0.53 percentage points to GDP. Equipment and Software investments contributed +0.34 percent points to Q1 GDP.
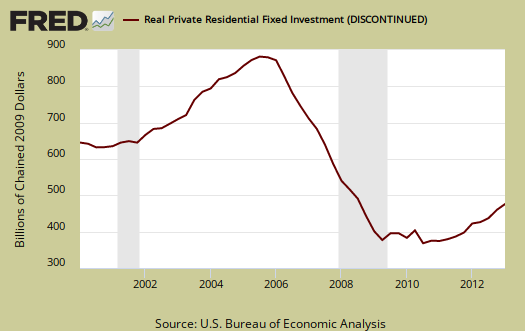
Part of fixed investment is Residential fixed investment. Residential contributed +0.30 percentage points to Q1 GDP. One can see the housing bubble collapse in the below graph and also the meteoric recovery. Yet by overall volume is still below the bubble years, in spite of dramatic increase in housing prices of recent.
Motor Vehicles as a whole, as output was +0.28 percentage points of Q1 real GDP. Computer final sales, added 0.02 percentage points from Q1 GDP. These categories are different from personal consumption, or C sub-components, such as auto & parts. These are overall separate indices to show how much they added to GDP overall. Motor vehicles, computers are bought as investment, as fleets, in bulk, by the government, as well as part of consumer spending, government spending and so on.
Services overall added a +0.84 percentage point contribution to GDP while goods, overall added +1.60 percentage points. Structures, overall, which is building activity, both residential and commercial and economic activity it generates, subtracted -0.06 percentage points to Q1 real GDP.
The price index for gross domestic purchases, was revised upward by 0.1 percentage points to 1.2% for Q1. In Q4 the price index was 1.6%. This means there was less inflation in comparison to last quarter. Since the price index is used to remove inflation from GDP to obtain real growth, less inflation means less price increases to eat away at economic growth. The core price index, or prices excluding food and energy products, was 1.4%, an upward revision of 0.2 percentage points .
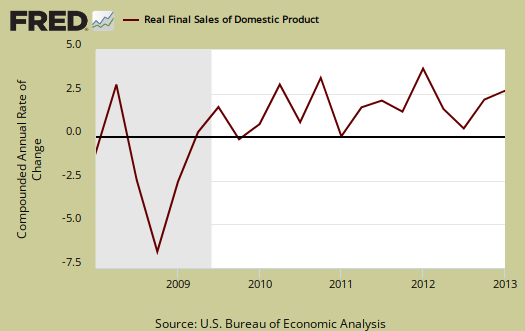
Real final sales of domestic product is GDP - inventories change. This gives a better feel for real demand in the economy. This is because while private inventories represent economic activity, the stuff is sitting on the shelf, it's not demanded or sold. Real final sales increased 1.8% for Q1, which reflects weak demand. Real final sales was revised upward 0.3 percentage points on lower changes in private inventories estimates. Q4 real final sales increased 1.9%.
Gross domestic purchases are what U.S. consumers bought no matter whether it was made in Ohio or China. It's defined as GDP plus imports and minus exports or using our above equation: where P = Real gross domestic purchases. Real gross domestic purchases only increased 2.5% in Q1 in comparison to no change in Q4. Exports are subtracted off because they are outta here, you can't buy 'em, but imports, as well a know all too well, are available for purchase at your local Walmart. When gross domestic purchases exceed GDP, that's actually bad news, it means America is buying imports instead of goods made domestically.
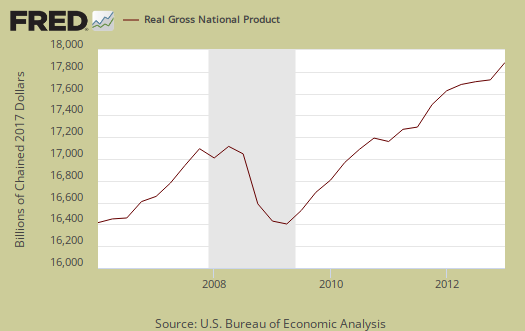
GNP - Gross National Product: Real gross national product, GNP, is the goods and services produced by the labor and property supplied by U.S. residents.
GNP = GDP + (Income receipts from the rest of the world) - (Income payments to the rest of the world)
Real GNP increased 1.5% in Q1 whereas in Q4 GNP increased 0.9%. GNP includes, GDP excludes net income from the rest of the world. GNP increases beyond GDP if Americans made out like bandits from foreign investments more than foreigners cashed in on investments within the U.S. borders. The fact GNP is less than GDP implies a lot of foreigners are making a lot of money while operating and investing within the U.S. borders.
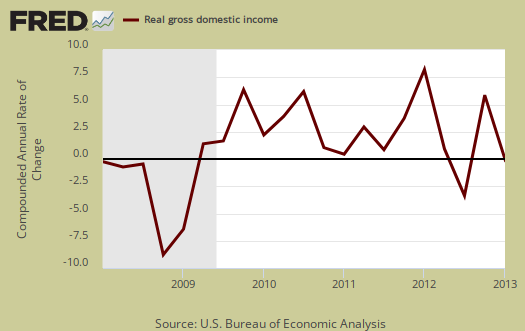
GDI - Gross Domestic Income: Gross Domestic Income is all income from within the borders of a nation and should normally equal GDP. GDI is wages, profits & taxes minus subsidies. Real GDI increased 2.5% in Q1 in comparison to a 5.5% increase in Q4.
Nominal GDP: In current dollars, not adjusted for prices, of the U.S. output,was $16,004.5 brillion, an 3.6% increase. In Q4 nominal GDP increased 1.3%.
Below are the percentage changes of Q1 2013 GDP components, from Q4. There is a difference between percentage change and percentage point change. Point change adds up to the total GDP percentage change and is reported above. The below is the individual quarterly percentage change, against themselves, of each component which makes up overall GDP. Additionally these changes are seasonally adjusted and reported by the BEA in annualized format.
|
Q1 2013 Component Percentage Change (annualized) |
|||
|---|---|---|---|
| Component | Percentage Change from Q4 | ||
| GDP | +2.4% | ||
| C | +3.4% | ||
| I | +9.0% | ||
| G | –4.9% | ||
| X | +0.8% | ||
| M | +1.9% | ||
Here is our overview for Q1 GDP advance estimate, Other reports on gross domestic product can be found here.
farm inventories > 1/3rd of GDP
you figure that big jump in farm inventories was just a seasonal adjustment aberration due to drought in earlier quarters? you know they werent filling their silos with corn harvested in january...
rjs
farm inventories include animals
They killed many more animals earlier as feed prices soared during the drought.
Side note, the entire concept of raising animals to be eaten is disgusting, especially how they stuff animals into way too small areas, cages and then they way they kill them is often inhumane.
I should be a vegetarian.
Yes, anyone notice beyond this site how farm inventory fluctuations boosting up GDP is completely ignored by the financial press and even many economists?