
The October 2012 ISM Manufacturing Survey PMI increased, 0.2 percentage points, to 51.7% and and is the second month for expansion. Officially manufacturing expanded at a faster rate, yet the low percentage change implies manufacturing is really holding on.

New Orders increased 1.9 percentage points, to 54.2%. New Orders inflection point, where expansion turns into contraction, is not 50%, it is 52.3%, so new orders is really moderate. From the ISM:
A New Orders Index above 52.3 percent, over time, is generally consistent with an increase in the Census Bureau's series on manufacturing orders.

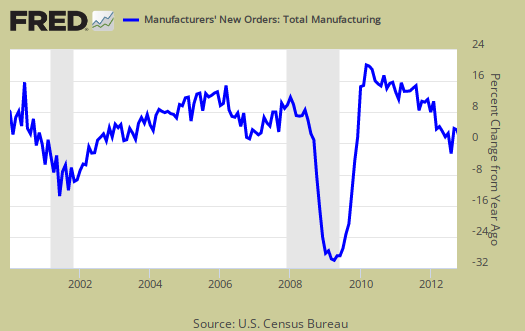
The Census reported manufactured durable goods new orders increased 9.9% in September where factory orders, or all of manufacturing data, will be out tomorrow. The ISM claims the Census and their survey are consistent with each other. To wit, below is a graph of manufacturing new orders percent change from one year ago (blue, scale on right), against ISM's manufacturing new orders index (maroon, scale on left) to the last release data available for the Census manufacturing statistics. Here we do see a consistent pattern between the two.
The ISM gives a descending ordered list of industry sectors whose new orders increased and this month there are only five sectors which showed increases.
The five industries reporting growth in new orders in October are: Furniture & Related Products; Food, Beverage & Tobacco Products; Paper Products; Computer & Electronic Products; and Miscellaneous Manufacturing. The eight industries reporting a decrease in new orders during October — listed in order — are: Primary Metals; Wood Products; Machinery; Electrical Equipment, Appliances & Components; Transportation Equipment; Chemical Products; Nonmetallic Mineral Products; and Apparel, Leather & Allied Products.
Below is the ISM table data, reprinted, for a quick view.
| Manufacturing at a Glance October 2012 | ||||||
|---|---|---|---|---|---|---|
| Index | Oct. | Sept. | % Point Chg. | Direction | Rate | Trend |
| PMI | 51.7 | 51.5 | +0.2 | Growing | Faster | 2 |
| New Orders | 54.2 | 52.3 | +1.9 | Growing | Faster | 2 |
| Production | 52.4 | 49.5 | +2.9 | Growing | From Contracting | 1 |
| Employment | 52.1 | 54.7 | -2.6 | Growing | Slower | 37 |
| Supplier Deliveries | 49.6 | 50.3 | -0.7 | Faster | From Slowing | 1 |
| Inventories | 50.0 | 50.5 | -0.5 | Unchanged | From Growing | 1 |
| Customers' Inventories | 49.0 | 49.5 | -0.5 | Too Low | Faster | 11 |
| Prices | 55.0 | 58.0 | -3.0 | Increasing | Slower | 3 |
| Backlog of Orders | 41.5 | 44.0 | -2.5 | Contracting | Faster | 7 |
| Exports | 48.0 | 48.5 | -0.5 | Contracting | Faster | 5 |
| Imports | 47.5 | 49.5 | -2.0 | Contracting | Faster | 3 |
| OVERALL ECONOMY | Growing | Faster | 41 | |||
| Manufacturing Sector | Growing | Faster | 2 | |||
Production, which is the current we're makin' stuff now meter, increased 2.9 percentage points from last month to 52.4% and moved into expansion. Production usually follows incoming orders so this is no surprise.

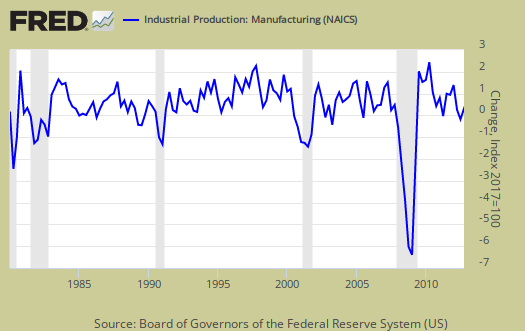
ISM's manufacturing production index loosely correlates to the Federal Reserve's industrial production, but not at 50% as the inflection point, instead 51.2% to indicate growth. Below is a graph of the ISM manufacturing production index (left, maroon), centered around the inflection point, quarterly average, against the Fed's manufacturing industrial production index's quarterly change (scale right, blue). We can see there is a matching pattern to the two different reports on manufacturing production.
The manufacturing ISM employment index dropped -2.6 percentage points to 52.1%. The neutral point for hiring vs. firing is 50.1%. Employment is a lagging indicator and the the ordered list of employment increases is below.
Of the 18 manufacturing industries, eight reported growth in employment in October in the following order: Apparel, Leather & Allied Products; Petroleum & Coal Products; Food, Beverage & Tobacco Products; Paper Products; Miscellaneous Manufacturing; Chemical Products; Transportation Equipment; and Primary Metals. The six industries reporting a decrease in employment in October — listed in order — are: Nonmetallic Mineral Products; Plastics & Rubber Products; Electrical Equipment, Appliances & Components; Fabricated Metal Products; Computer & Electronic Products; and Wood Products.
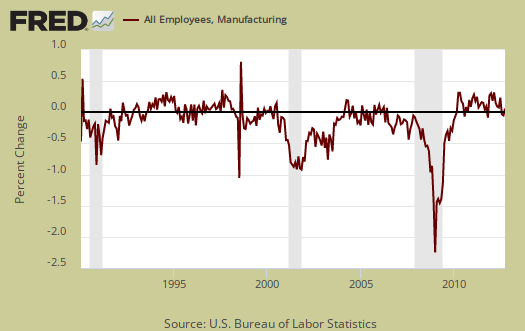
Below are the BLS manufacturing non-farm payrolls (jobs) for the past decade on the left (maroon), graphed against the ISM manufacturing employment index on the right (blue). The BLS manufacturing payrolls is the monthly percentage change and the ISM manufacturing employment index is centered around it's inflection point of contraction and employment growth. This is just monthly change, manufacturing has lost approximately 6 million jobs over the graphed time period.
Inventories declined -0.5 percentage points to 50.0%, which is still growing, but slower. The ISM claims inventories are correlated to manufacturing inputs, that are part of GDP. Changes in business inventories, of which manufacturing is only a part, added 0.30 percentage points to Q3 2012's 2.0% GDP.
An Inventories Index greater than 42.8 percent, over time, is generally consistent with expansion in the Bureau of Economic Analysis' (BEA) figures on overall manufacturing inventories.

Supplier deliveries are how fast manufacturers can get their supplies. A value higher than 50 indicates slower delivery times, a value below 50 means the supply chain is speeding up. The index decreased -0.7 percentage points to 49.6% and the went from slowing for last month to speeding up. That sure should chance with Hurricane Sandy for next month's report.

Backlog of orders decreased -2.5 percentage points to 41.5%. Order backlogs are still in contraction, now for seven consecutive months. More order backlogs would imply production and thus hiring might be stepped up. Order backlogs are exactly what they sound like and only 86% of survey respondents reported on order backlogs. Petroleum & Coal were the biggest sector for increased order backlogs.

Imports decreased -2.0 percent points to 47.5% and are in contraction. Imports are materials from other countries manufacturers use to make their products.

New orders destined for export, or for customers outside of the United States, decreased -0.5 percentage point to 48.0% and is in contraction, the 5th month in a row. The exports index is now lower than June 2009's 49.5%.

The ISM price index decreased -3.0 percentage points to 55.0%. Prices are what manufacturers pay to make their products and this month means prices are increasing, but at a slower rate than September. In April 2009 the price subindex was 32%.

Customer's inventories decreased -0.5 percentage points to 49.0%. Below 50 means customer's inventories are considered by manufacturers to be too low. Customer inventories, not to be confused with manufacturer's inventories, are how much customers have on hand, and rates the level of inventories the organization's customers have. An increase might indicate weak demand.

Two of the comments from ISM survey respondents mentioned weak demand from Europe is affecting their orders and another mentioned demand was soft.
Here is the ISM industrial sector ordered list of growth and contraction:
Of the 18 manufacturing industries, eight are reporting growth in October in the following order: Petroleum & Coal Products; Furniture & Related Products; Apparel, Leather & Allied Products; Paper Products; Miscellaneous Manufacturing; Food, Beverage & Tobacco Products; Plastics & Rubber Products; and Chemical Products. The eight industries reporting contraction in October — listed in order — are: Primary Metals; Wood Products; Machinery; Fabricated Metal Products; Transportation Equipment; Electrical Equipment, Appliances & Components; Computer & Electronic Products; and Nonmetallic Mineral Products.
The ISM has a correlation formula to annualized real GDP, but they are now noting the past correlation. Notice also that the PMI went to equal weighting in 2008. October's data, the ISM get a 3.1% 2012 annual real GDP. The below graph plots real GDP, left scale, against PMI, right scale, GDP up to Q3 2012. One needs to look at the pattern of the two lines to get anything out of this by quarters graph. If they match, GDP goes up, PMI goes up, would imply some correlation. ISM claims the January to October PMI indicates a 3.2% annual GDP.

The ISM neutral point is 50, generally. Above is growth, below is contraction, There is some some variance in the individual indexes and their actual inflection points. For example, A manufacturing PMI above 42, over time, also indicates growth, even while manufacturing is in the dumpster.
Here is last month's manufacturing ISM overview, unrevised.
The ISM has much more data, tables, graphs and analysis on their website. For more graphs like the above, see St. Louis Federal Reserve Fred database and graphing system.
PMI™ stands for purchasing manager's index.
On ISM correlations to other indexes, when in dollars they normalized to 2000 values. The above graphs do not do that, so our graphs are much more rough than what the ISM reports these indices track.
Hi Robert, Great detailed
Hi Robert,
Great detailed analysis of the inner component's in this month's ISM. A fairly stark contrast to the trends in alternative Markit PMI report for the month, although at 51% and 51.7%, I suppose they're not so different in absolute terms!
The US data this month (with ISM recovering from the summer doldrums, improvements in New Orders and Production components) seems to be a rare bright spot in terms of PMI analysis. Apart from HSBC Chinese PMI making an 8-month high, little coverage seems to have been given to the stalling of the PMI recovery in Europe, and a further deterioration in Japan. Germany, Italy and Spain particularly have bucked previously improving trends, I've covered it in an article here: http://bigmacropicture.blogspot.co.uk/2012/11/global-economy-november-4t...
I suppose an important question is, will we see continued momentum in the recovery of the Chinese and US economies, where monetary policy is starting to filter into business conditions? Can it offset deteriorations in other parts of the world? And how important is the weakening dollar in that equation, given how difficult European and Japanese producers are finding it to compete?
Keep up the good work,
Mark A. Rogers
Big Macro Picture
Register for on anonymous comments don't allow links due to spammers and thus people miss your excellent global PMI analysis, click here to read.
I agree, 51%, at 2009 lows vs. 51.7% and crowds cheer (?)< really?
Love to see some analysis on QE and it's real effects. We overviewed a Fed piece which came down to $2.6 trillion for $2 million jobs (this site is called The Economic Populist for a reason!)
But we haven't done much on other macro economic indicators.
We like cross posts and I personally like manufacturing PMI as an indicator. We could use a solid global analysis on what's happening and we especially like seeing where the financial and debt crisis is in Europe or if we see some QE effects on manufacturing. I have noticed prices really seem to be effected.
Great site you have there!