
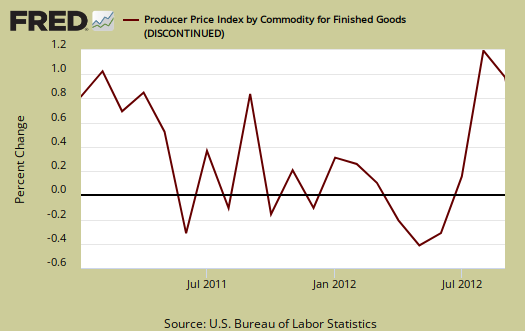
In September, Producer Price Index, or wholesale inflation, increased 1.1% for finished goods and is the 2nd month in row for a jump. August PPI increased 1.7%. Gasoline again is the cause, with prices surging 9.8%. Gasoline was the culprit for 80% of the energy index ballooning by 4.7%. Food also increased by 0.2%. Core PPI, which are finished goods minus food and energy prices, had no change for the month. While PPI is wholesale inflation, retail shoppers beware, price increases are usually passed onto consumers.
PPI is reported by stages of processing of materials, finished, intermediate and crude. Finished are commodities ready for final sale, intermediate are partially finished, such as lumber and cotton and crude are products entering the market for the first time, such as raw grain and crude oil.
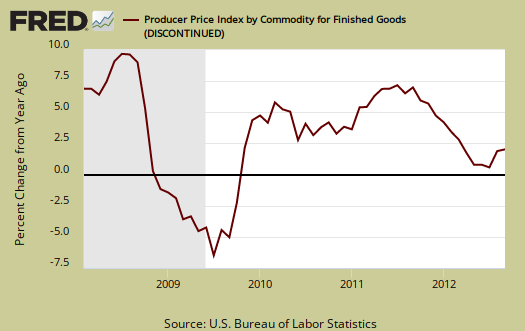
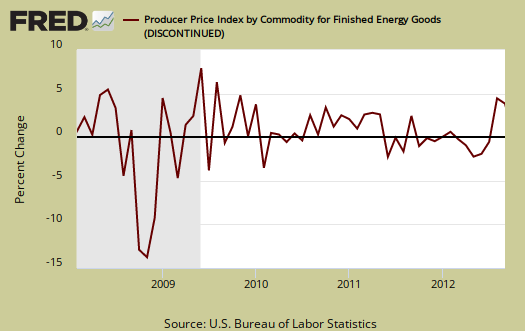
Unadjusted, finished goods have increased 2.1% for the last 12 months, the highest monthly increase since March 2012. Graphed below is wholesale finished goods PPI percent change for the year.
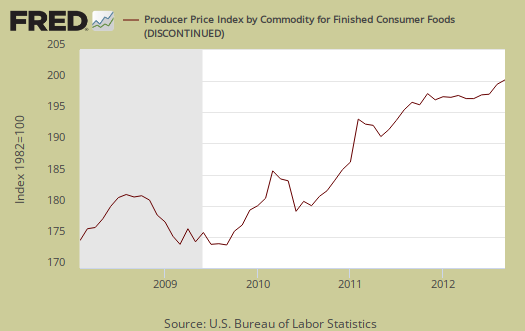
The increase in food prices was due to dairy, which increased 2.8% for the month. Fresh fruits and melons also caused the increase for they jumped 11.1%.
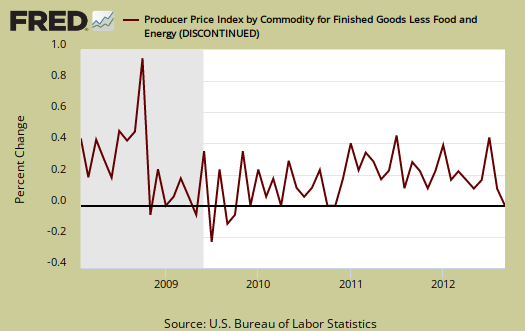
Core PPI, or finished goods minus food and energy, was unchanged from the previous month. Light trucks increased 0.3%, but computers dropped -2.4% and communications equipment declined -0.7%.
Below is the monthly percentage change of finished energy only, to show the soaring prices. Residential gas increased 1.3%, home heating oil is up 3.1%, electricity, 0.3% and those never ending high wholesale gas prices increased 9.8%.
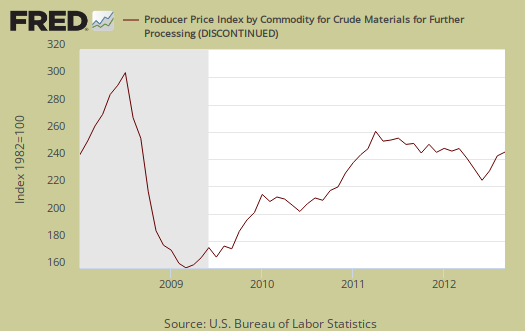
The real story on this month's PPI are crude wholesale prices. Products classified as crude are raw materials, entering the market for the 1st time and are the items which are further processed or go into other products. Crude PPI increased 2.8% for September after soaring 5.8% in August. On a quarterly basis, we're breaking even as the last three months crude PPI has increased 10.7%, yet the previous three months crude prices declined -10.8%. Once again oil is the culprit as crude petroleum increased 11.4% for September. Crude energy overall increased 4.4% for the month.
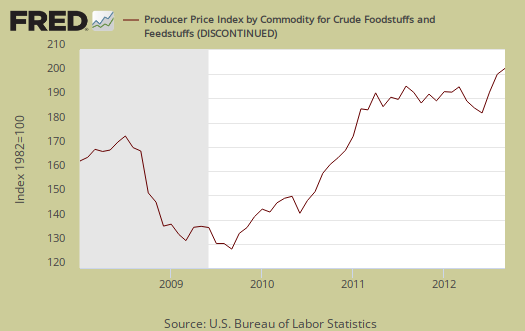
Crude food has increased 11.8% from June to September with a 1.6% increase for the month. The crude food jump is 60% hay, hayseeds and hayseed oil which increased 6.8% for the month.
Crude core increased 1.6% for the month and for the last three months has increased 2.6%. The report attributes 85% of this increase to nonferrous metals, which jumped up 2.5%.
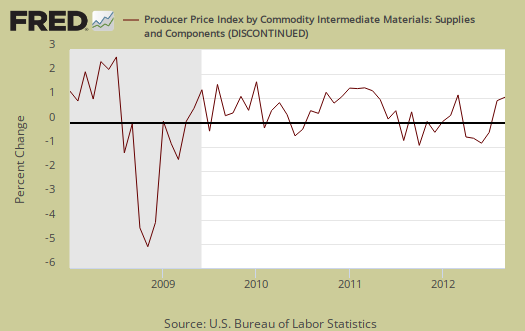
For intermediate wholesale goods we had a 1.5% increase and this is largest jump since February 2011. This month the increase was broad based, not just energy. Diesel increased 9.2% with intermediate energy overall increasing 4.3%.
Intermediate food prices was up by 2.0%, the 4th monthly consecutive increase and once again drought looks like the culprit. Animal feeds jumped again 5.1% are the about 75% of the total intermediate foods prices increase, the same causation percentage as last month.
Intermediate core actually also increased 0.6% for September, after four months of declines. The report blames 50% of this rise on organic chemicals, which increased 3.0% for the month.
 alt="" />
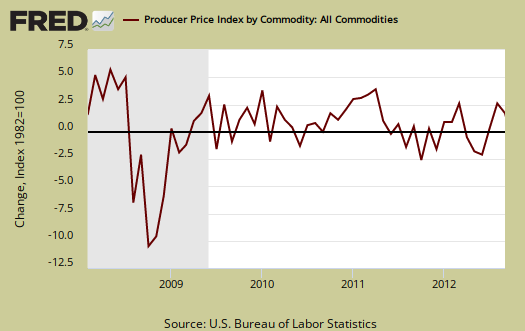
Below is the indexed price change for all commodities. Commodities are not limited to what comes from inside the United States. Here's the BLS definition of commodities by classification.
The commodity classification structure of the PPI organizes goods and services by similarity of material composition or end use, disregarding their industry of origin.
Commodities should start soaring due to the Fed's quantitative easing. For September, overall commodities increased 0.9% with farm products increasing 0.4% and gasoline increasing 6.8%. These are not seasonally adjusted, unlike the other PPI indexes.
PPI also has special indexes which measure services and their margins. From the report it looks like prices just cut into profit margins:
Trade industries: The Producer Price Index for the net output of total trade industries rose 0.9 percent in September following a 1.3-percent drop in August. (Trade indexes measure changes in margins received by wholesalers and retailers.) Leading this increase, margins received by wholesale trade industries moved up 1.6 percent. Higher margins received by grocery stores and by electronic shopping and mail-order houses also contributed to the advance in the total trade
industries index.Transportation and warehousing industries: The Producer Price Index for the net output of transportation and warehousing industries declined 1.0 percent in September following a 0.4 percent rise in August. This decrease can be mostly attributed to prices received by the scheduled passenger air transportation industry, which fell 7.3 percent. The indexes for deep sea freight transportation and nonscheduled air passenger chartering also were factors in the decline in the transportation and warehousing industries index.
Traditional service industries: The Producer Price Index for the net output of total traditional service industries decreased 0.2 percent in September after a 0.6-percent advance in August. Prices received by general medical and surgical hospitals, which moved down 1.1 percent, accounted for about seventy percent of this decline. Lower prices received by the industries for investment banking and securities dealing and for commercial banking also contributed to the
decrease in the total traditional service industries index.
The Federal Reserves believes their core inflation target rate of 2.0% annual is safe and secure but real people, main street need to eat and drive their cars to work, so soaring energy and food prices do matter in the real world.
Here is the BLS website for more details on the Producer Price Index. They list individual items and special indexes.
Here is our PPI overview from last month.
Recent comments