
Q3 GDP 2010 was revised upward 0.1% to 2.6%, for the 3rd revision. Here is the BEA press release.
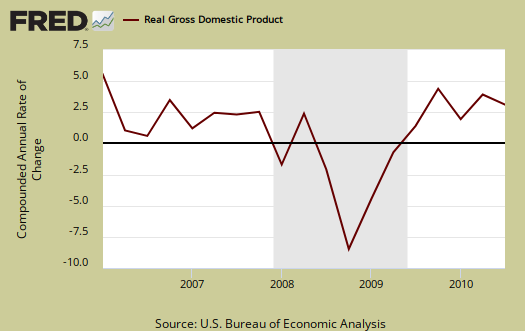
The revision a 10th of a percentage point is a little misleading, for the BEA rounds up to only 1 decimal place in GDP (due to accuracy), the actual Q3 3rd revision GDP was 2.55%.
As a reminder, GDP is made up of:
where
Y=GDP, C=Consumption, I=Investment, G=Government Spending, (X-M)=Net Exports, X=Exports, M=Imports.
Here is the Q3 2010 3rd revision breakdown of GDP percentage points:
- C = +1.67
- I = +1.80
- G = +0.79
- X = +0.82
- M = –2.53
Here is the Q3 2010 second revision breakdown of GDP percentage points:
- C = +1.97
- I = +1.51
- G = +0.81
- X = +0.77
- M = –2.52
Below are the percentage point differences between the third and the second revision GDP report components:
- C = -0.30
- I = +0.29
- G = -0.02
- X = +0.05
- M = -0.01
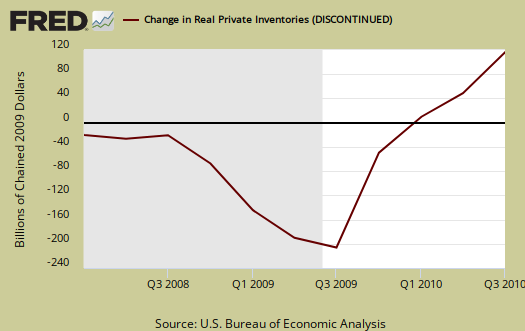
Changes in inventories were revised considerably by -0.31 percentage points, to 1.61. Of the total 2.55% or minus inventory changes, Q3 2010 GDP would have been 0.94%, so this revision reverts back to growth being 63.1% inventory changes. Nonresidential fixed investment was +0.93, yet residential was -0.75 percentage points, and why fixed investment only contributed 0.18 percentage points of the 2.55% GDP change.
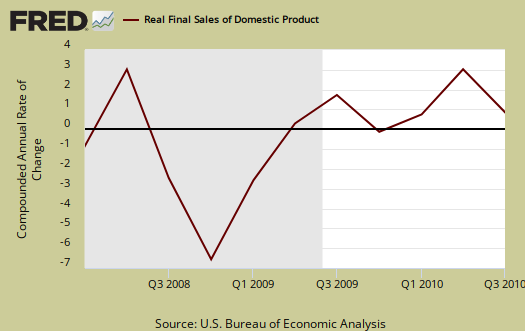
Below are real final sales of domestic product, or GDP - inventories change. This gives a better feel for real demand in the economy. This is the worse news of this revision, it shows real demand is on life support.
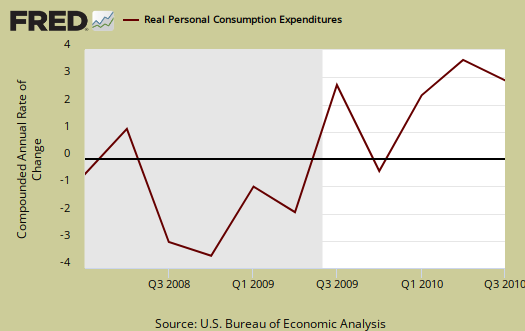
Below the the St. Louis FRED graph for C, or real personal consumption expenditures of the above GDP equation. PCE was revised significantly downward to the point gross investment I, was the strongest component of 3rd quarter 2010 GDP.
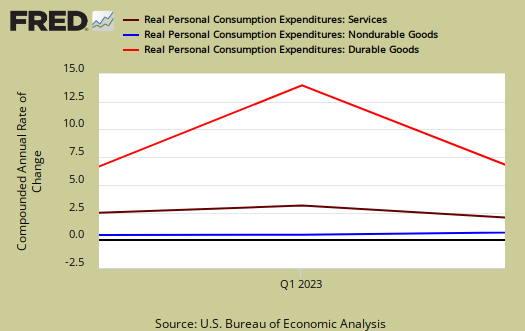
Below is the breakdown in C or real PCE annualized change. Notice when times are tough, durable goods (bright red) consumption drops. This 3rd GDP revision in personal consumption services expenditures was huge, now a 0.74 percentage point contribution to GDP grwoth from 1.16, a -0.42 percentage point difference between revisions. Notice Financial Services subtracted –0.27 percentage points off of GDP. Who knew liar loans affected economic growth to such an extent?
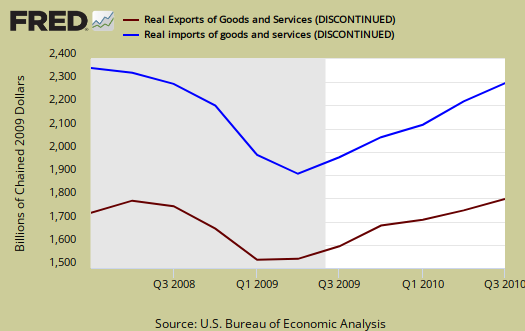
Imports literally wipes out GDP growth, –2.53 percentage points are subtracted from GDP annualized growth totals. The trade deficit now contributes -1.70 percent points to the total 2.55% Q3 2010 GDP.

The below graph is real imports vs. exports. While exports increased, it is the trade deficit that matters. We can see imports decreased, it's still a major drag on the economy.
Below are the percentage changes of GDP components in comparison to the second revision Q3 2010 GDP report:
- C = +2.4%, revised -0.4%
- I = +15.0%, revised +2.6%
- G = +3.9%, revised -0.1%
- X = +6.8%, revised +0.5%
- M = +16.8%, revised 0.0%
The BEA's comparisons in percentage change breakdown from Q2 2010 are below. Notice the decline in residential investment.
C: Real personal consumption expenditures increased 2.4% in the Q3, compared with an increase of 2.2% in the second.
I: Real nonresidential fixed investment increased 10.0%, compared with an increase of 17.2%. Nonresidential structures decreased 3.5%, compared with a decrease of 0.5%. Equipment and software increased 15.4%, compared with an increase of 24.8%. Real residential fixed investment decreased 27.3%, in contrast to an increase of 25.7%.
X & M: Real exports of goods and services increased 6.8% in the third quarter, compared with an increase of 9.1% in Q2. Real imports of goods and services increased 16.8%, compared with an increase of 33.5%.
G: Real federal government consumption expenditures and gross investment increased 8.8% in Q3, compared with an increase of 9.1% in the second. National defense increased 8.5%, compared with an increase of 7.4%. Nondefense increased 9.5%, compared with an increase of 12.8%. Real state and local government consumption expenditures and gross investment increased 0.7% (note the advance report had a decrease of -0.2%) compared to an increase of 0.6%.
Motor Vehicles, was revised down, but still an amazing comeback in Q3 2010. Motor Vehicles is still 0.49 percentage points of GDP and Computers were 0.27 percentage points. Structures were a -0.09 percentage points of Q3 2010 GDP contribution, revised up. Residential fixed investment subtracted off -0.75 percentage points to GDP. Equipment and software were revised down to a 1.02 percentage point contribution to Q3 2010 GDP.
On Gross National Product there was a decrease in net income receipts, a large revision.
Real gross national product -- the goods and services produced by the labor and property supplied by U.S. residents -- increased 2.3 percent in the third quarter, compared with an increase of 1.8 percent in the second. GNP includes, and GDP excludes, net receipts of income from the rest of the world, which decreased $7.1 billion in the third quarter after increasing $3.7 billion in the second; in the third quarter, receipts increased $5.9 billion, and payments increased $13.0 billion.
Real Gross Domestic purchases, which is whatever people in the U.S. bought, regardless of country of origin, increased 4.2% in comparison of a 5.1% increase in Q2 2010.
The Price index was also revised slightly down:
The price index for gross domestic purchases, which measures prices paid by U.S. residents, increased 0.7 percent in the third quarter, 0.1 percentage point less than the second estimate; this index increased 0.1 percent in the second quarter. Excluding food and energy prices, the price index for gross domestic purchases increased 0.4 percent in the third quarter, compared with an increase of 0.8 percent
in the second.
Here are the graphs from Q3 2010 GDP, 2nd revision report.
Recent comments