
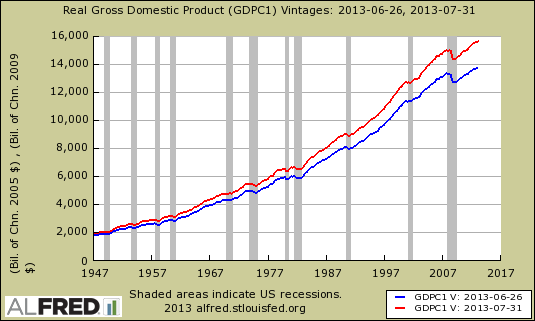
The Bureau of Economic Analysis has revised the National Income and Product Accounts all the way back to 1928. With the release of Q2 GDP, Gross Domestic Product magically added $559.8 billion to 2012 GDP in current dollars. Additionally the chained dollar base year was changed from 2005 to 2009, a very funky year where some deflation from 2008 was still present. Below is a graph of real valued GDP before and after revisions. The red line presents the new values after revisions, the blue line the old.
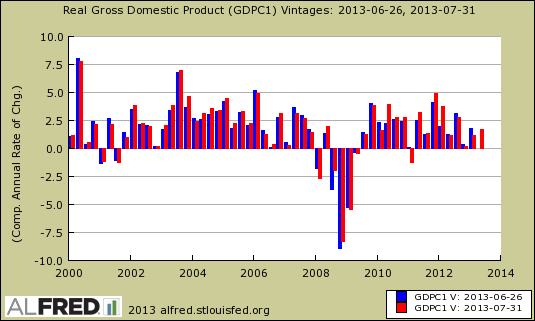
Below is the change of GDP and what the revisions brought. We can see the quarterly revisions below. 2012 alone gained 0.6 additional percentage points to annual GDP. For the decade of 2002-2012 the new methodology gave an additional 0.2 percentage points on average per year to GDP.
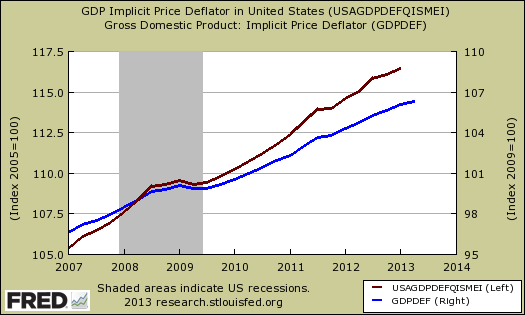
Below is a comparison of the GDP price deflator. The index based on 2005 values in is maroon, scale on the left, and the new one introduced with Q2 GDP, based on 2009 values, scale on the right. The price index is the main divisor by which we get real values, so one can compare past years and not attribute GDP growth or contract to inflation or deflation. That's quite a different slope between the two.
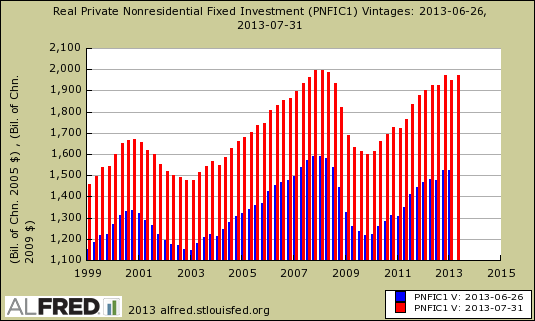
One of the biggest changes is adding R&D as an investment instead of treating it as an expense. Basically we went from the minus to the plus column in accounting and pumped up GDP by $314 billion as a result. Below is a graph showing all fixed investment before these sweeping changes and after. In all of the following graphs, the red line presents the new values after revisions, the blue line the old.
The problem is who and what is considered R&D. We also have a serious question for the pharmaceutical sector especially offshore outsourced R&D back in 2006. As we can see Big Pharma spends the most in R&D, yet we also know they fired almost every PhD in the United States from 2002 to 2006 and invested heavily in plants, R&D facilities in China and India. Below is the BEA graph on which sectors spend, oops, strike that, invest on R&D, now considered adding to economic growth by the activity itself.
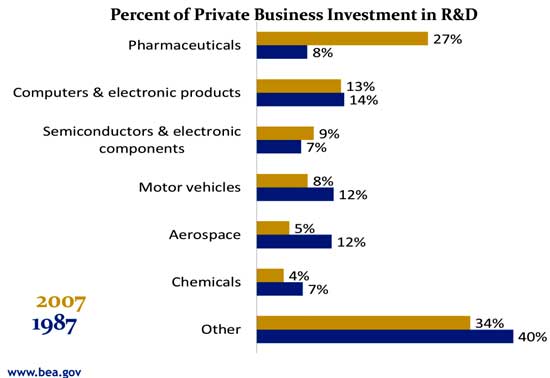
The BEA claims to separate domestic R&D from that which is offshore outsourced, our concern above:
BEA recognizes domestically-performed R&D as U.S. assets and excludes R&D performed abroad by foreign affiliates of U.S. companies. BEA also recognizes the sales and purchases of R&D assets, such as patents, in its measures of exports and imports. When possible, BEA will try to separately identify these transactions and classify them as acquisition or disposal of R&D assets. Currently these transactions are included in exports and imports of royalties and license fees.
We wonder how accurate this can possibly be. Companies routinely these days import foreign guest workers and technology transfer out of the country with these foreign workers. In other words one can claim R&D is being performed domestically, when in truth, maybe just the initiative, general concept was produced inside the United States yet testing and especially drug trials, are performed outside the United States. We also wonder how an expense, such as research which may, or may not result in any products or revenues, is magically now an asset. In a supposedly knowledge economy, the BEA is trying to capture, economic activity which is much more closely tied to the citizens of the nation than actual geographical location, simply because research is much more worker oriented. Finally, corporations may own resulting intellectual property, yet we know it is routine to create SPVs and park pools of patents in the Caymans. How the offshore outsourcing of patents themselves is accounted for is still a mystery and obviously a real domestic economic problem.
The BEA presentation of the new knowledge economy seems to read more like a multinational corporate lobbyist presentation that solid macro economics and national accounts. We don't have any answers yet it sure seems like phantom GDP will be on the rise.
Another huge change was treating original films, sound recordings, manuscripts, etc., that can be used for the production and sale of copies as part of GDP. This is now fixed investment instead of the actual income such assets give. Content, artistic works have to be long lived, which supposedly will filter out the instant bad shows we are bombarded with daily on Cable. Yet, isn't Netflix and Hulu streaming every unwatchable movie ever made at the moment? So, here too we have some unusual additions which have managed to add $70 billion to GDP
National income is also now puffed up with potentially unfunded pension contributions by Federal, state and local governments. Think Detroit and how they just declared bankruptcy with public workers pensions at risk. With unfunded or under funded pension plans, counting the supposed promise versus what is actually contributed artificially pumps up personal income. Below is a graph of real disposable income and we can see American just gained a whole lot more money than previously by these changes in methodologies as well as using 2009 as the chained index year.
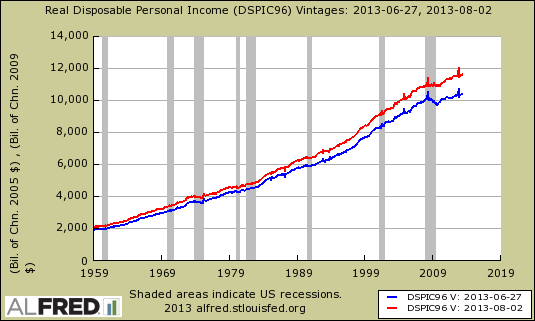
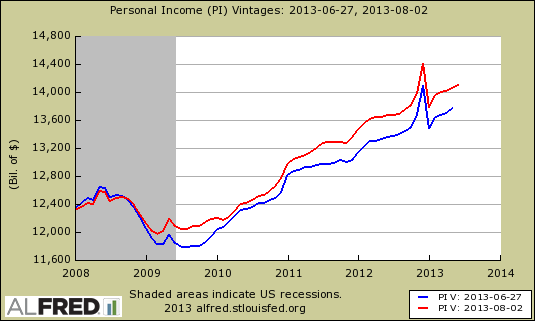
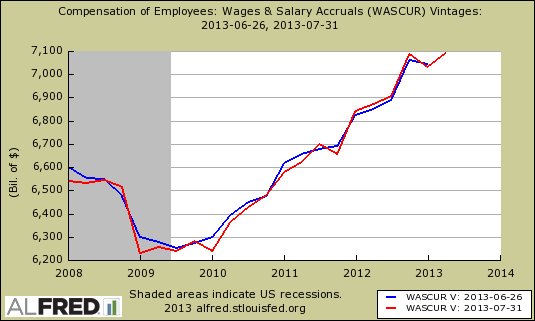
Personal income itself is now on the accrual accounting method. Accrual accounting is tabulating supposed to happen events, whether or not a transaction has taken place. Now this is going on with personal income, anyone here think they can count money they have not received to pay bills and Visa, Mastercard will just understand? The graph below shows on a general scale America has much more personal income now than before these changes. Look in your wallet to see the imaginary dollars.
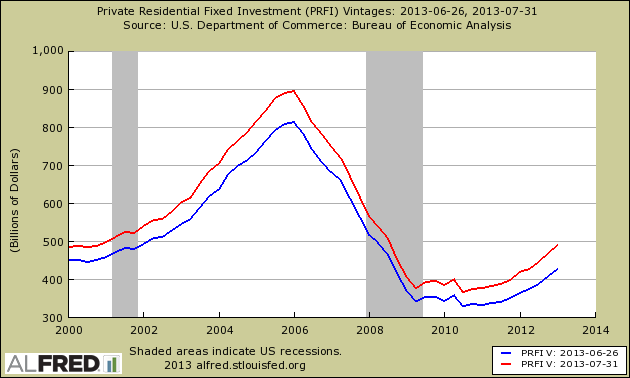
The BEA also managed to squeeze out another $70 billion in GDP by moving transfer ownership costs of residential property as an investment. Now we see this as costs, period, yet with the new treatment we have a whopping change in the fixed residential real estate investment portion of GDP. Now the housing bust does look quite as bad, n'est-ce pas?
There are many more changes than covered here, such as changing financial services computing and adding capital gains attributable to corporate partners into proprietor's income. These are our hedge fund pals, using limited partnerships and other techniques to pay a 15% income tax instead of the 39.6% they should be paying.
Beginning with 1993, the estimates of proprietors’ income are improved by more accurately accounting for the capital gains and losses attributable to corporate partners.
Some of the adjustments do make sense and there are also benchmarks, more complete data, but others we have to wonder if the goal was simply to make the economy look better than it really is. Take this for example on banking services:
Exclude expected credit losses from borrower services
Is seem the BEA is counting income before it arrives but isn't using the same accounting method for expected consumer defaults? We expect much more analysis in the coming months for what just happened. Yet the BEA statistics are so complex, almost all in America, never mind the financial press, didn't blink an eye at what just happened.
The New York Times did a different analysis to show how the revisions make debt to GDP ratios appear better. Contrary to the New York Times claim, imaginary wages did not decrease with the revisions as shown in the below graph.
The puffing up of GDP with the listed above is what makes workers share of the GDP an even smaller slice of the economic pie while corporate profits just got a bigger bite.
Before the figures were revised, it appeared that wages and salary income in 2012 amounted to 44 percent of G.D.P., the lowest at any time since 1929, which is as far back as the data goes. But the revisions cut that to 42.6 percent, which matched the revised 2010 figure as the lowest ever. The flip side of that is that corporate profits after taxes amounted to a record 9.7 percent of G.D.P. Each of the last three years has been higher than the earlier record high, of 9.1 percent, which was set in 1929.
Others in the financial press are claiming these changes will make it impossible to compare U.S. GDP to other nations.
Including the above components into GDP will make a comparison of US GDP to GDP of other countries impossible. Even if the other countries follow the same methodology, the guidelines have become so liberal and subjective that no meaningful comparison is now possible. Countries with high GDP to debt ratios will have a vested interest inflating their GDP to make their economies appear robust.
In addition, states and municipalities with underfunded plans will also seem prosperous. States such as California and New York will be at less risk of being downgraded. Maybe if this new accounting had been implemented sooner, Stockton would not have gone bankrupt.
Some financial analysts are so appalled with the new additions they are simply wiping out the Shadow Stats and claiming it's all a conspiracy. We're in the paranoid camp, yet are fully aware of the complexity and difficulty involved in measuring a national economy. Yet, one has to wonder sometimes for we know the economic driver of an economy is still good old fashioned manufacturing, not dot cons and social media making billions off of profiling us and creating like buttons.
References
- BEA FAQ on R&D
- BEA Comprehensive Revision preview
- Briefing on the 2013 Comprehensive NIPA Revision
When things get bad, the lies become more obvious
Now if only I could pay my bills with these imaginary new dollars or income, but the same old rules apply to me. The folks in charge are desperate to continue the Ponzi, lies, fraud, globalization, outsourcing, political scams, corruption, whatever, they will resort to anything. it's obvious to anyone now that cares. What's that? A 9 year old made a rug or soccer ball overseas that an American bought at some point in the American's life? And the product was made using a needle that was at some point transported on a tire made in the US? Great, chalk it up to US GNP. Let's say the tire and labor and soccer ball are worth $1,000,000 to the US because why even bother with reality or logic anymore. And because the American got some use and joy out of the soccer ball or rug, let's say that "joy" is worth $5,000,000 because it sounds good. Whatever happens, never, never, never revise false stats down (unless it's inflation and unemployment) and never say things are getting worse for American citizens. That simply won't do. Full speed ahead, let's see if we can break that iceberg in two, we're the Titanic after all, and we can't sink!
This post points out elements which are disturbing
Very amusing, let's label Joy an economic activity. Animal spirits and behavioral economics anyone, where is the GDP in getting America to set their alarm clocks, is that next?
On a more serious note, to really dig into the NIPA is a long term study and as it was, I did quite a bit of digging to write this article, but by no means is this written in stone or complete, for the details are still missing, not fully understood.
I imagine we will soon have all sorts of white papers, analysis from Academia on these new additions, or I would hope so, for counting corporate offshore outsourcing activities as U.S. domestic economic activity is just a slap in the face, never mind wrong but sorting out the methods on R&D is research.
big statistical change
the change from chained 2005 chained dollars to 2009 chained dollars is larger than i would have expected; i'll have to keep this in mind next time i write about it..
rjs