
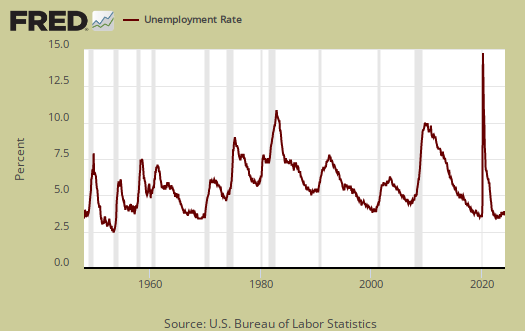
The November unemployment report is another OK type of report. Less people were dropped out of the labor force for the month and the labor participation rate did tick up a tenth of a percentage point from the October 1977 record low. The official unemployment rate did not change and is 5.0%. Overall, this month's report is on the positive side.
This article overviews and graphs the statistics from the Employment report Household Survey also known as CPS, or current population survey. The CPS survey tells us about people employed, not employed, looking for work and not counted at all. The household survey has large swings on a monthly basis as well as a large margin of sampling error. This part of the employment report is not about actual jobs gained but people and their labor status.
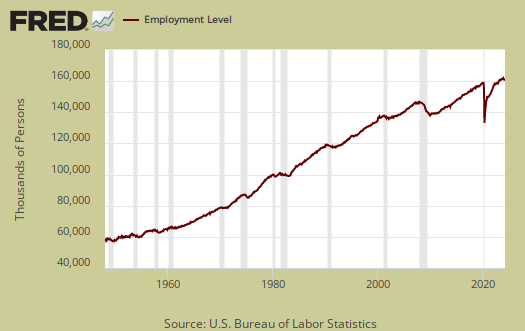
Those employed increased by 244,000 this month and stands at 149,364,000. From a year ago, the ranks of the employed has increased by 2.03 million. This has been the annual gain for some time.
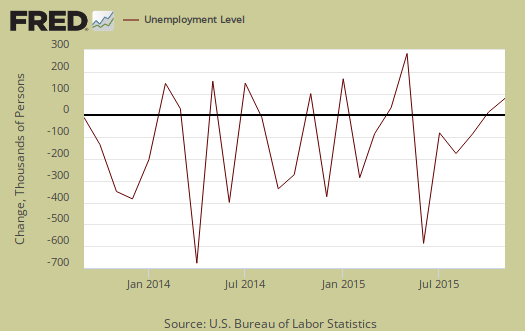
Those unemployed increased by 29,000 to stand at 7,937,000. From a year ago the unemployed has decreased by -1.134 million. Below is the month change in unemployed which typically has wild swings from month to month.
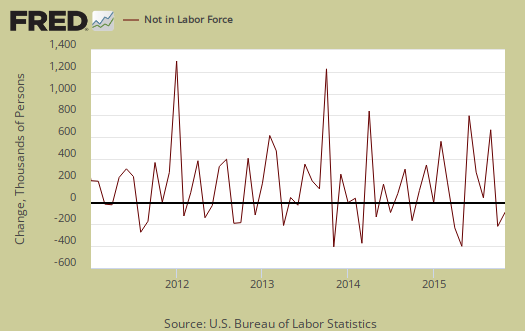
Those not in the labor force decreased for a consecutive month by -67,000 to 94.45 million. The below graph is the monthly change of the not in the labor force ranks. Those not in the labor force has increased by 2,004,000 in the past year. While there is now two consecutive months ofdeluge abatement, those not in the labor force have grown more than those employed in the last year.
The labor participation rate finally ticked up by 0.1 percentage points to 62.5%, which is still in lows not seen since the 80's.

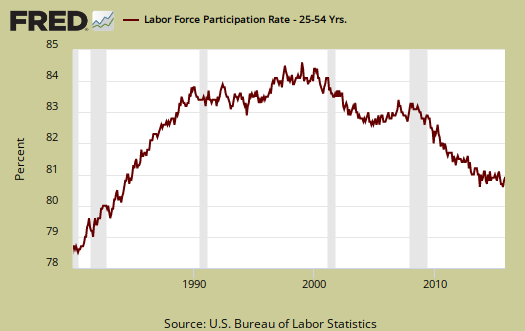
Below is a graph of the labor participation rate for those between the ages of 25 to 54. The rate is 80.8%, which is a 0.1 percentage point increase from last month. Using the prime working years participation rate proves the record lows cannot be explained away by retirement and higher educational pursuits.
The civilian labor force, which consists of the employed and the officially unemployed, increased by 273 thousand this month, negating last month's decline. The civilian labor force has grown by 899,000 over the past year. The annual growth rate increased from last month but is still low. New workers enter the labor force every day from increased population inside the United States and immigration, both legal and illegal. The small annual figure also implies people are dropping out of the labor force. Notice how those not in the labor force has grown much bigger than the civilian labor force.

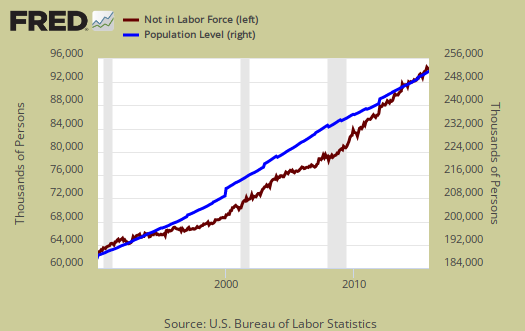
Those not in the labor force now grows the same as the population which has the potential to work. Below is a graph of those not in the labor force, (maroon, scale on the left), against the noninstitutional civilian population (blue, scale on the right). Notice how those not in the labor force crosses the noninstitutional civilian population in growth and the accelerated growth started happening right in 2008. With this month's report the rate for both is about the same.
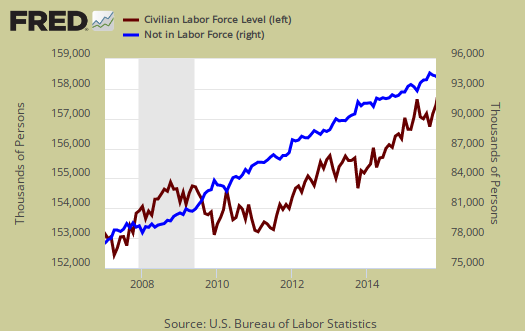
Below is a graph of the civilian labor force, or the official employed plus unemployed, in maroon, scale on left, against those not in the labor force, in blue, scale on right. See how those not in the labor force as a trend exceeded those considered employed and unemployed starting around mid 2009. Starting in 2014 it has reverted back, yet look at how is it reverted once again in 2015. The never ending growing segment of the population that is considered neither employed or unemployed, was above the trend line of those who would be naturally dropping out, such as the retired and those in school. This shows those not in the labor force has been growing much faster than those obtaining jobs and being counted as looking for work. Those not in the labor force does include retirees and the size of the population 65 and older has grown.
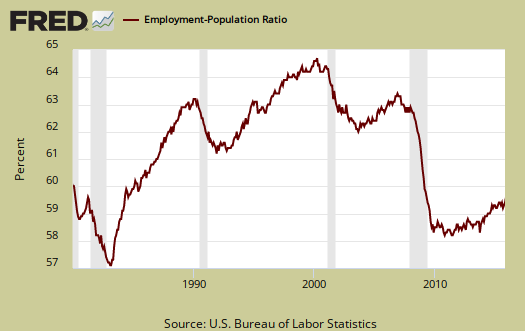
Those considered employed as a ratio to the total Civilian noninstitutional population now stands at 59.3%, which is no change from last month. The relationship between the employment-population ratio and the labor participation rate (LPR) is: employment-population ratio = LPR * (1 - unemployment rate).
A more foreboding metric was those forced into part-time work due to the economy increased this month by 319 thousand. . Those forced into part time work for economic reasons stands at 6,086,000 people. The annual decrease is now -770 thousand, which is much less than last month.
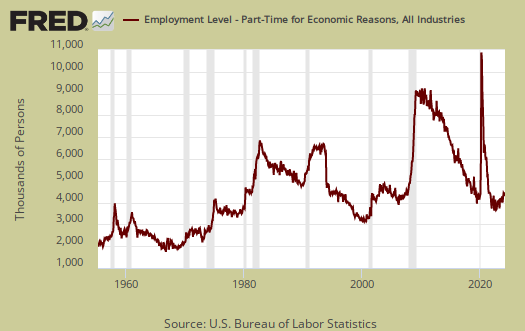
There are two categories of those forced into part-time jobs due to economic circumstances. Those who could only get part-time jobs and those already working who got their hours cut due to businesses not having enough work for them. The number of people who could only get part-time work increased by 44,000 as shown below.

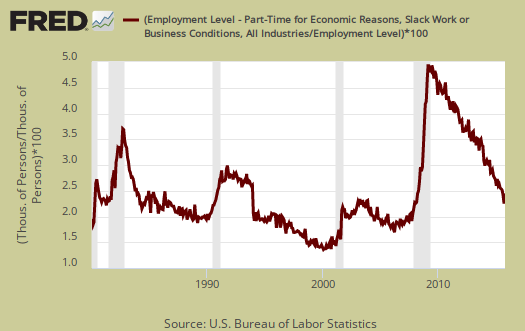
People can also work part-time hours due to slack business demand. People who got their hours cut due to slack working conditions jumped up by 256,000 and stands at 3,535,000. Below is a graph of forced into part-time work because they got their hours cut, as a percentage of the total employed. This is a recession economic indicator and this figure just is still elevated, yet this figure has now plunged by 936 thousand from last year mostly due to the last two months over half a million decline.
Part-time workers who are voluntarily working part-time jobs decreased by -12,000 to stand at 20,157,000.

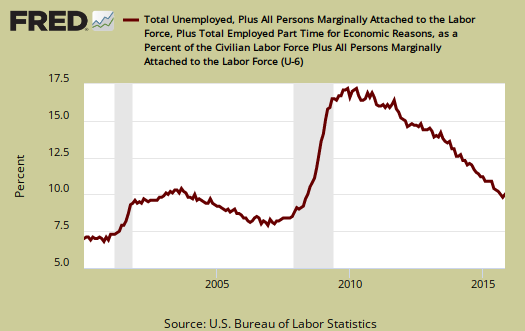
U-6 now stands at 9.9% a 0.1 percentage point increase. U-6 is a broader measure of unemployment and includes the official unemployed, people working part-time hours because that's all they can get and a subgroup not counted in the labor force but are available for work and looked in the last 12 months. The U-6 rate still leaves out some people wanting a job who are not considered part of the labor force, so while it is called an alternative rate, but it still ignores many who should be counted as unemployed.
The newly unemployed increased by 36.000 and those unemployed for less than five weeks increased by 80 thousand to stand at 2,406,000. Below is a graph of those unemployed for less than five weeks.

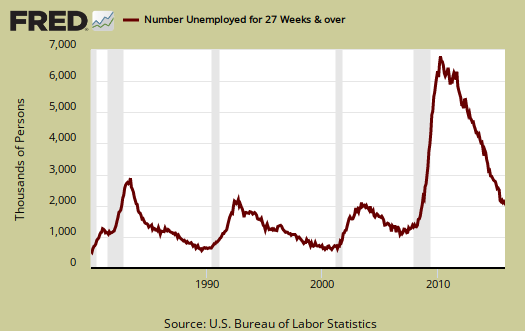
The long term unemployed, or those unemployed for 27 weeks and over, dropped by -92 thousand to 2,050,000 people. From a year ago the long term unemployed ranks has declined by -772,000. This decline without a corresponding bump up in employed can imply many long term unemployed are simply not being counted versus no longer needing a job.
Within the CPS survey is how many people who are considered not in the labor force who report they want a job now. It is a direct survey question. The Census asks people who are not being counted in the unemployment statistics and official unemployment rate if they want a job. The number who answer yes currently stands at 5,636,000, and plunged by -416 thousand from last month. Those who are not counted yet report they want a job includes the discouraged workers and marginally attached and is seasonally adjusted. This figure has decreased by -920 thousand from a year ago. This is actually a very good sign from this report and implies many long term unemployed no longer even counted by the BLS at getting work again. Either that or they have died off or married rich since the rise in this population segment has been going on since 2007.

The average length of unemployment is 28 weeks and a year ago was 33 weeks. This is no change from last month The average time to be unemployed is out of line with the median due to the long term unemployed.

The median time one is unemployed, which means 50% of people have gotten a job in this amount of time is 10.8 weeks and decreased by -0.2 weeks from last month. A year ago the median time to be unemployed was 12.8 weeks and this figure has been steadily decreasing.

This month's CPS report is a solid sign of improving conditions and stability for out of work America. The increase in slack working conditions is a very negative sign and might coincide with some of the other negative economic indicators of late. Here are our past overviews CPS unemployment statistics, only graphs revised.
Recent comments