
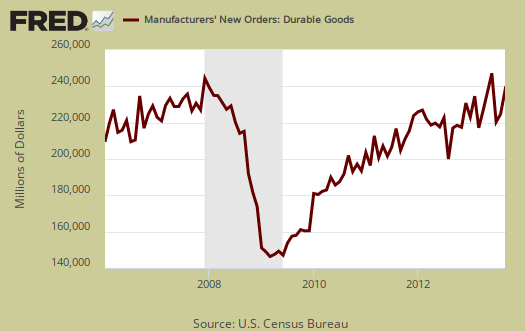
The Durable Goods, advance report shows new orders increased by 3.7% for September 2013, but the gains are due to volatile aircraft and parts orders. Without transportation orders, which aircraft is a large part, durable goods new orders fell by -0.1%. Shipments increased by 0.2% and are at a record high level.
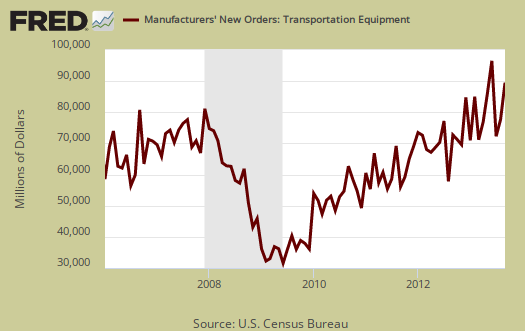
Below is a graph of all transportation equipment new orders, which increased by 112.3% for the month. Motor vehicles & parts actually declined by -0.3%. Aircraft and parts new orders from the non-defense sector increased 57.5%. Aircraft & parts from the defense sector increased 15.2%. Aircraft orders are notoriously volatile, each order is worth millions if not billions, and as a result aircraft manufacturing can skew durable goods new orders on a monthly comparison basis.
Core capital goods new orders declined by -1.1% for September, which implies a major slowing of economic activity. Core capital goods is an investment gauge for the bet the private sector is placing on America's future economic growth and excludes aircraft & parts and defense capital goods. Capital goods are things like machinery for factories, measurement equipment, truck fleets, computers and so on. Capital goods are basically the investment types of products one needs to run a business. and often big ticket items. A decline in new orders indicates businesses are not reinvesting in themselves. Machinery by itself showed a -1.8% drop in new orders. In July core capital goods new orders dropped by -3.5%, so Q3 has shaken out to be in contraction. August showed a 0.4% increase.
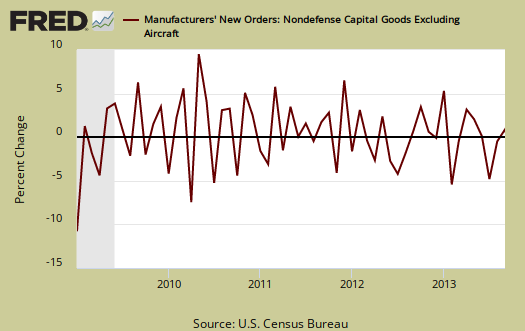
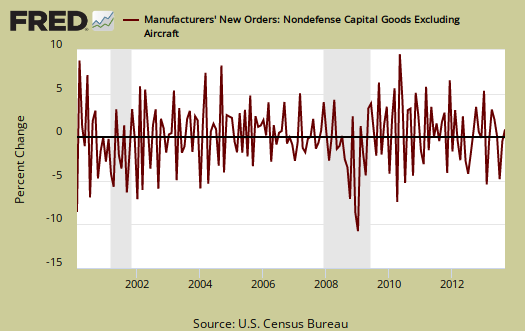
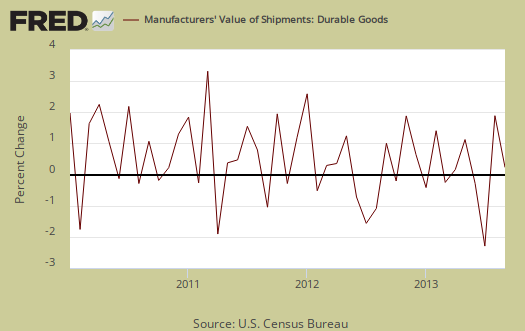
To put the monthly percentage change in perspective, below is the graph of core capital goods new orders, monthly percentage change going back to 2000. Looks like noise right? That's why one advance report does not an economy make. Yet over and over again Wall street trades on these figures and even worse, just the magic new order monthly percentage change.
Shipments overall increased 0.2% and bear in mind new orders are not necessarily shipped the next month an order is made. Primary metals alone saw a 0.8% increase in shipments. Below is the monthly shipments; percent change for all durable goods shipments.
Shipments in core capital goods decreased -0.2% as machinery shipments declined by -1.2%.
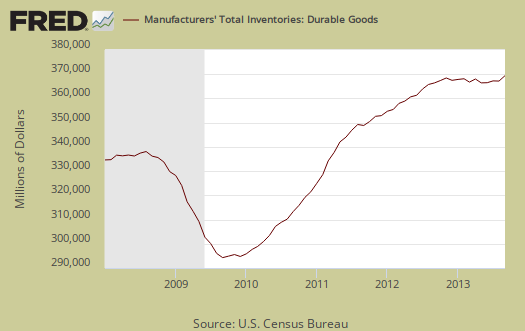
Inventories, which also contributes to GDP, increased 0.9% for September. Excluding transportation, inventories increased 0.6% for the month. Graphed below are total durable goods inventories monthly figures.
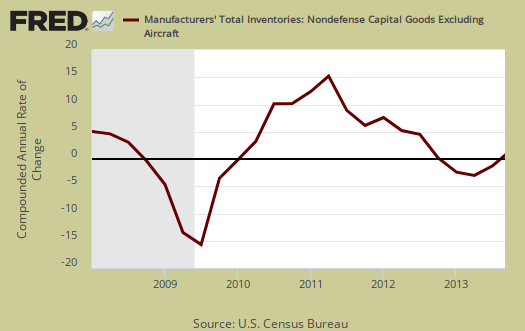
Core Capital Goods inventories increased 0.6% for September. August saw a 0.1% increase while July showed a -0,1% decline in core capital goods inventories. Graphed below are quarterly core capital goods inventories annualized percentage change and for Q3 was 0.2%. In Q2 this value was -2.7% In other words, this implies the durable goods manufacturing inventory component to GDP should be much improved and will help out with Q3 GDP, unlike shipments shown below.
Core shipments contributes to the investment component of GDP. Producer's Durable Equipment (PDE) is part of the GDP investment metric, the I in GDP or nonresidential fixed investment. It is not all, but part of the total investment categories for GDP, usually contributing about 50% to the total investment metric (except recently where inventories have been the dominant factor). Producer's Durable Equipment (PDE) is about 75%, or 3/4th of the durable goods core capital goods shipments, in real dollars, used as an approximation. Below is the national accounts description of PDE:
Nonresidential PDE consists of private business purchases on capital account of new machinery, equipment such as furniture, and vehicles (except for personal-use portions of equipment purchased for both business and personal use, which are included in PCE), dealers' margins on sales of used equipment, and net purchases of used equipment from government agencies, from persons, and from the rest of the world.
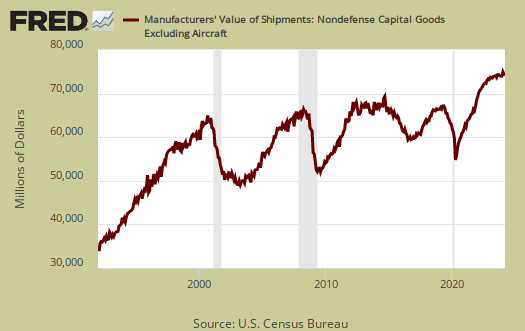
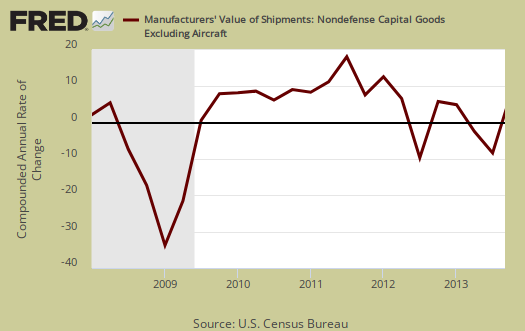
The below graph might give a feel for what kind of investment component we might see on PDE for Q3 2013 GDP.  This is the monthly percentage change of nominal values, not real, not adjusted for inflation, for core capital goods shipments. %nbsp;This implies Q3 GDP investment component will be low as core capital goods shipments declined at an annualized -2.9% rate for Q3 2013.
Overall, durable goods is looking bad as a Q3 GDP indicator and this report's data was gathered before the great government shutdown. What is a durable good? It's stuff manufactured that's supposed to last at least 3 years. Here are our durable goods, related overviews, only some graphs revised. The durable goods advance report is often revised when the full factory orders statistics are released.
Recent comments