
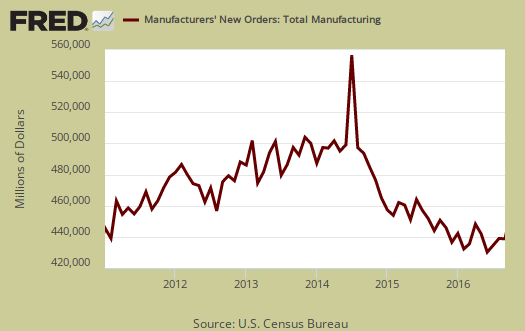
The Manufacturers' Shipments, Inventories, and Orders report shows factory new orders increased by 0.3% for September. That's after August new orders rose by 0.4%. Durable goods new orders by themselves was revised down to -0.3% for September, but increased 0.2% in August. Transportation new orders were the worse, with a -1.1% decline. The year to date in comparison to the same time period in 2015, new orders are down -2.3% while just durable goods new orders have had a -0.4 year to date change. Inventories for the month had no change but are down -1.9% for the year. The Census manufacturing statistical release is called Factory Orders by the press and covers both durable and non-durable manufacturing orders, shipments and inventories.
Within transportation equipment, motor vehicles bodies & parts new orders increased by 2.6%. Aircraft new orders increased 21.1% in nondefense and declined in defense by -47.6%. Ships and boats new orders decreased by -17.8%. There are other categories of transportation equipment not listed in the report, so don't blame it all on volatile aircraft, and the increase in autos & parts is a saving grace.
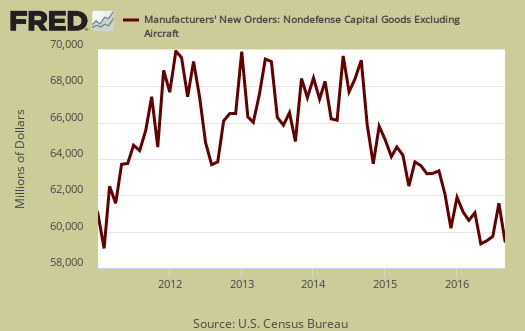
Core capital goods new orders decreased by -1.3%. The previous month showed a 1.2% increase. Core capital goods are capital or business investment goods and excludes defense and aircraft. This is all pretty bad, not something you want to see to indicate real economic growth.
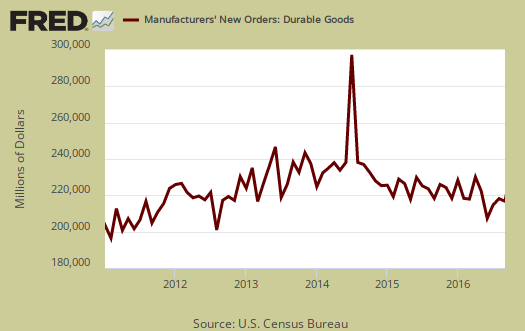
Nondurable goods new orders increased by 0.9%, but are down -4.1% for the year. Manufactured durable goods new orders decreased -0.3%
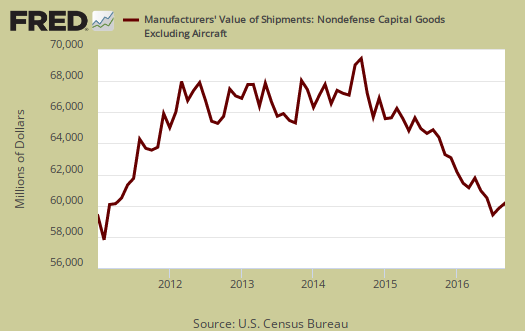
Shipments overall increased 0.8% for September. Durable goods shipments increased 0.8% as well. Nondurable goods shipments increased 0.9%. Core capital goods shipments increased by 0.4%. Core capital goods shipments go into the GDP calculation. Below is a graph of core capital goods shipments.
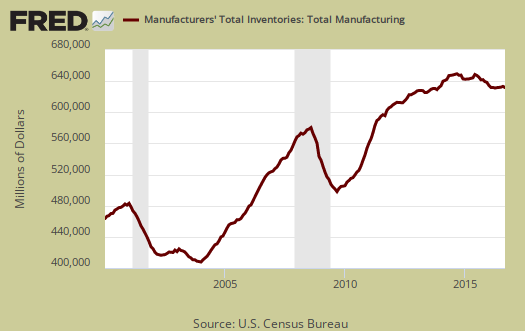
Inventories for manufacturing overall had no change. Durable goods inventories increased 0.1% but are up slightly for three consecutive months now. Core capital goods inventories increased 0.1%. Nondurable goods inventories decreased -0.2%, and are down -2.1% for the same time a year ago. For the same time this year, overall manufacturing inventories have declined by -1.9%. Durable goods inventories have dropped by -1.8% also for the year.
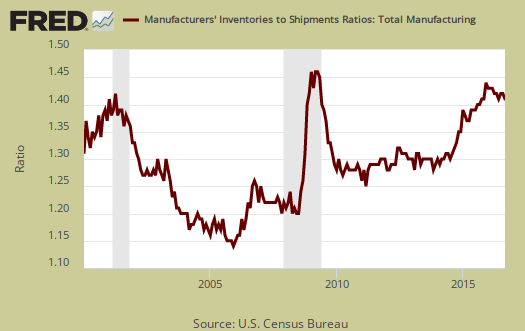
The inventory to shipments ratio was 1.34, whereas August was 1.35. When ratios increase it can imply economic sluggishness.
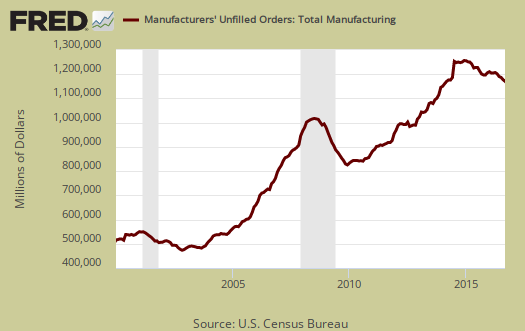
Unfilled Orders decreased by -0.4%. Durable goods unfilled orders also declined by -0.4%. Core capital goods unfilled orders increased by 0.2%.
Generally speaking this report shows a so so new orders. It's not great news yet it is not bad news, more just business as usual news.
Part of this report goes into calculating GDP. The BEA takes this report, called M3, and uses the shipments values to calculate investment in private equipment, investment in software. Manufacturing inventories also goes into the changes in private inventories GDP calculation. At the bottom of this post is a little more information to estimate part of the GDP investment component.
The St. Louis Federal Reserve FRED graphing system has added individual NAICS data series from this report. If you're looking for a graph of some particular NAICS category, such as light trucks, autos & parts, or machinery, it might be found on FRED. Most news outlets source the Commerce Department, while technically correct, also makes it impossible for you, our beloved detailed reader, to find the actual statistical report and data which you might be focused in on. There is much more detail in the statistical tables published by the Census website for manufacturing statistics.
Recent comments