
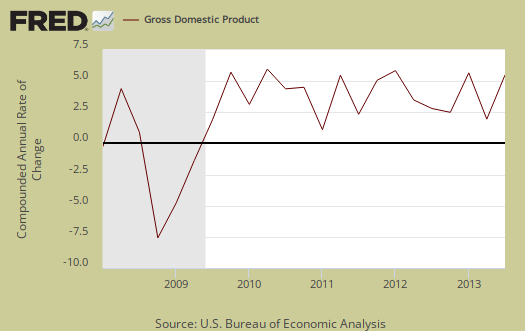
Q3 2013 real GDP had a blow out revision and is now 3.6%. Originally GDP was reported to be 2.8% for the third quarter. As estimated, dramatically increasing inventory accumulation was the main cause of the large upward revision to GDP. Changes in inventories accounted for 46.5% of Q3 GDP. The increasing trade deficit shaved off 0.23 percentage points, as predicted. Actual economic demand is weaker in the third quarter in comparison to the 2nd. Additionally large inventory accumulation can imply a slowing economy.

As a reminder, GDP is made up of: where Y=GDP, C=Consumption, I=Investment, G=Government Spending, (X-M)=Net Exports, X=Exports, M=Imports*. GDP in this overview, unless explicitly stated otherwise, refers to real GDP. Real GDP is in chained 2009 dollars.
The below table shows the Q3 revisions and percentage point spread between the major components of Q3 GDP. As we can investment shot way up and changes in private inventories is part of the investment component of GDP.
| Comparison of Q3 2013 Component Revisions | |||
|---|---|---|---|
|
Component |
Q3 2013 1st Revision |
Q3 2013 2nd Revision |
Spread |
| GDP | +2.83 | +3.61 | +078 |
| C | +1.04 | +0.96 | -0.08 |
| I | +1.45 | +2.49 | +1.04 |
| G | +0.04 | +0.09 | +0.05 |
| X | +0.60 | +0.50 | -0.10 |
| M | –0.30 | -0.43 | -0.13 |
This next table shows the percentage point spread breakdown from Q2 to Q3 GDP major components. GDP percentage point component contributions are calculated individually. Here we see consumer spending is down in comparison to Q2. Exports show less growth but imports also decreased.
| Comparison of Q3 2013 and Q2 2013 GDP Components | |||
|---|---|---|---|
|
Component |
Q3 2013 |
Q2 2013 |
Spread |
| GDP | +3.61 | +2.49 | +1.12 |
| C | +0.96 | +1.24 | -0.28 |
| I | +2.49 | +1.38 | +1.11 |
| G | +0.09 | -0.07 | +0.16 |
| X | +0.50 | +1.04 | -0.54 |
| M | -0.43 | -1.10 | +0.67 |
Consumer spending, C in our GDP equation, shows less growth than Q2 and was revised down. Most of consumer spending, was in goods, which added 0.93 percentage points to GDP growth contribution. Services within consumer spending only added 0.02 percentage points to GDP with housing and utilities subtracting -0.28 percentage points. Below is a percentage change graph in real consumer spending going back to 2000.

Graphed below is PCE with the quarterly annualized percentage change breakdown of durable goods (red or bright red), nondurable goods (blue) versus services (maroon).

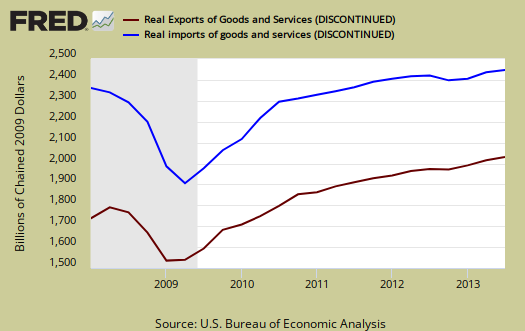
Imports and Exports, M & X added almost nothing, 0.07 percentage points to Q3 GDP as imports grew less than exports. The same scenario happened in Q2 . Any pundit prattled on about exports ignores the fact trade deficits are what matters, the two together. Trade deficits subtract from economic growth.
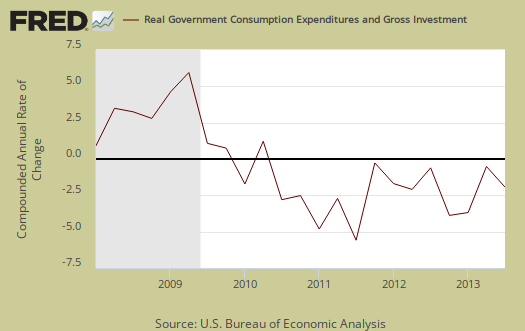
Government spending, G was +0.09 percentage points of Q3 GDP. This implies the great sequester negative economic impact is finally abating Federal government spending was still a drag on the economy with a -0.10 percentage point contribution. State and local, on the other hand, contributed 0.19 percentage points to Q3 GDP. Below is the percentage quarterly change of government spending, adjusted for prices, annualized.
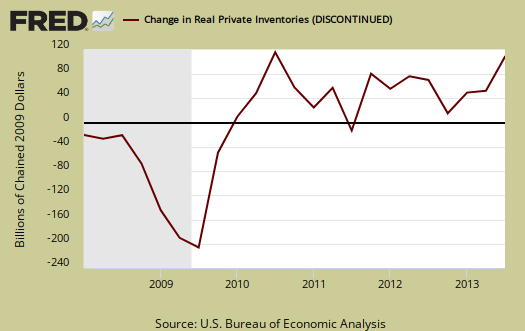
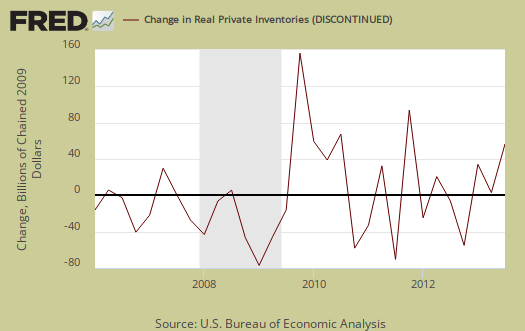
Investment, I is made up of fixed investment and changes to private inventories. The change in private inventories alone gave a +1.68 percentage point contribution to Q3. Changes in private inventories in Q2 were a +0.41 percentage point contribution to GDP. Below are the change in real private inventories and the next graph is the change in that value from the previous quarter. What goes up usually comes crashing down and note the 2009 time frame in the below graphs. Sudden inventory accumulation might mean businesses are not selling their wares well so stuff is sitting on the shelves. For now be aware there is an oversupply of petroleum lying around and we hope to examine inventories again to see what gives in terms of oversupply versus people not buying. Regardless of cause, a massive increase in non-farm inventories implies a very low Q4 GDP.
Fixed investment is residential and nonresidential and shows some growth in the Q3 GDP report, about as much growth as it was in Q2. Overall, fixed investment contributed +0.81 percentage points to GDP. Nonresidential added 0.42 percentage points, although structures, part of nonresidential investment, added 0.36 percentage points to GDP. Equipment was a big fat zero.
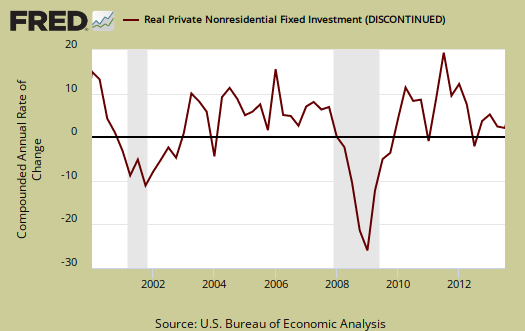
Part of fixed investment is Residential fixed investment. Residential contributed +0.38 percentage points to Q3 GDP, revised down from +0.42 percentage points. One can see the housing bubble collapse in the below graph and also how there is no meteoric recovery in terms of economic growth, but a modest one, for the last three quarters, in spite of all of the housing hype talk. Still, better than negative, but we can see our much ignored trade deficit is about the same by percentage points.

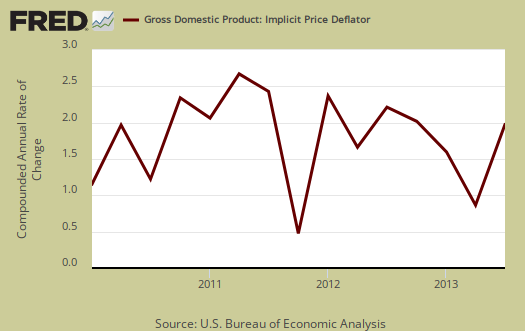
The price index for gross domestic purchases, increased by1.8% for Q3 in comparison to 0.2% for Q2. Minus food and energy the price index increased 1.5%, so with falling gas prices we can expect the core price index to be lower in Q4. The overall GDP price deflator was 2.0%. Below is a graph of the price index.
Nominal GDP: In current dollars, not adjusted for prices, of the U.S. output,was $16,890.8 billion, a 5.6% annualized increase from Q2. In Q2, current dollar GDP increased 3.1%. This goes to show what a difference the price deflator makes in real GDP.
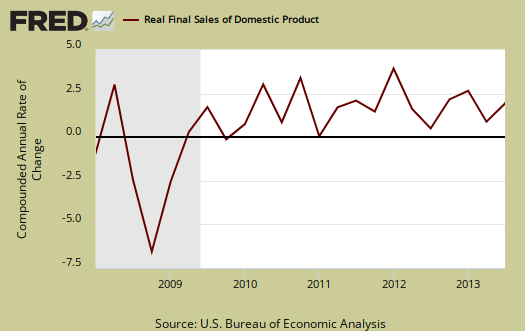
Real final sales of domestic product is GDP - inventories change. This gives a better feel for real demand in the economy. This is because while private inventories represent economic activity, the stuff is sitting on the shelf, it's not demanded or sold . Real final sales increased 1.9% for Q3, which reflects relatively mediocre real demand in the economy Q2 real final sales were 2.1%.
Gross domestic purchases are what U.S. consumers bought no matter whether it was made in Ohio or China.   ; It's defined as GDP plus imports and minus exports or using our above equation: where P = Real gross domestic purchases. Real gross domestic purchases increased 3.4% in Q3, whereas Q2 was 2.5%. Exports are subtracted off because they are outta here, you can't buy 'em, but imports, as well a know all too well, are available for purchase at your local Walmart. When gross domestic purchases exceed GDP, that's actually bad news, it means America is buying imports instead of goods made domestically. Considering how inventories saved the GDP day for Q3, a 3.4% increase in gross domestic purchases isn't good news. All hail Amazon, Apple and Walmart. Just in case you are reading this, Motorola is manufacturing Android phones in the United States, thanks Google.
GNP - Gross National Product: Real gross national product, GNP, is the goods and services produced by the labor and property supplied by U.S. residents.
GNP = GDP + (Income receipts from the rest of the world) - (Income payments to the rest of the world)
Real GNP increased 3.9% for Q3. In Q2 GNP increased 2.7%. GNP includes, whereas GDP excludes, net income from the rest of the world. GNP increases beyond GDP if Americans made out like bandits from foreign investments more than foreigners cashed in on investments within the U.S. borders. The fact GNP is more than GDP implies a lot of super rich and Wall Street types made beaucoup bucks abroad.

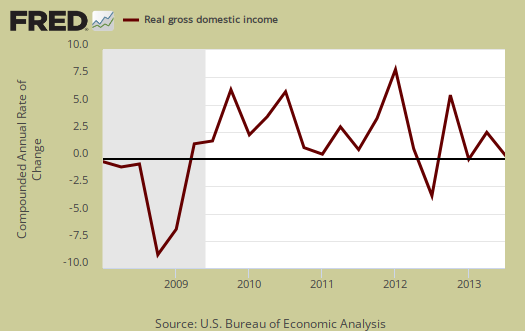
GDI - Gross Domestic Income: Gross Domestic Income is all income from within the borders of a nation and should normally equal GDP. GDI is wages, profits & taxes minus subsidies. Real GDI increased 1.4% in Q3 in comparison to a 3.2% increase in Q2. The BEA says GDI measures the economic output as the costs incurred as well as incomes earned in the production of GDP.
Below are the percentage changes of Q3 2013 GDP components, from Q2. There is a difference between percentage change and percentage point change. Point change adds up to the total GDP percentage change and is reported above. The below is the individual quarterly percentage change, against themselves, of each component which makes up overall GDP. Additionally these changes are seasonally adjusted and reported by the BEA in annualized format.
|
Q3 2013 GDP Component Percentage Change (annualized) |
|||
|---|---|---|---|
| Component | Percentage Change from Q2 | ||
| GDP | +3.6% | ||
| C | +1.4% | ||
| I | +16.7% | ||
| G | +0.4% | ||
| X | +3.7% | ||
| M | +2.7% | ||
The BEA's comparisons in percentage change breakdown of the 3rd quarter GDP components are below. Changes to private inventories is a component of I.
C: Real personal consumption expenditures increased 1.4 percent in the third quarter, compared with an increase of 1.8 percent in the second. Durable goods increased 7.7 percent, compared with an increase of 6.2 percent. Nondurable goods increased 2.4 percent, compared with an increase of 1.6 percent. Services was unchanged in the third quarter; in the second quarter, services increased 1.2 percent.
I: Real nonresidential fixed investment increased 3.5 percent in the third quarter, compared with an increase of 4.7 percent in the second. Nonresidential structures increased 13.8 percent, compared with an increase of 17.6 percent. Equipment was unchanged in the third quarter; in the second quarter, equipment increased 3.3 percent. Intellectual property products increased 1.7 percent, in contrast to a decrease of 1.5 percent. Real residential fixed investment increased 13.0 percent, compared with an increase of 14.2 percent.
X & M: Real exports of goods and services increased 3.7 percent in the third quarter, compared with an increase of 8.0 percent in the second. Real imports of goods and services increased 2.7 percent, compared with an increase of 6.9 percent.
G: Real federal government consumption expenditures and gross investment decreased 1.4 percent in the third quarter, compared with a decrease of 1.6 percent in the second. National defense decreased 0.3 percent, compared with a decrease of 0.6 percent. Nondefense decreased 3.1 percent, the same decrease as in the second quarter. Real state and local government consumption expenditures and gross investment increased 1.7 percent, compared with an increase of 0.4 percent.
Other overviews on gross domestic product can be found here.
Recent comments