
For months now, the words which describe the jobs crisis are little change. It is like the United States is stuck in time when it comes to the never ending dire unemployment statistics. The BLS employment report shows a 7.9% unemployment rate for January. December's unemployment rate was 7.8%. January also incorporates annual adjustments in the unemployment statistics. This article overviews and graphs the statistics from the Current Population Survey of the employment report.

The biggest mistake some in the press make is to compare the December to January unemployment statistics directly. Due to annual adjustments that cannot be done, as we explain in this post. Fortunately the BLS offers a table estimating what the December to January changes are after removing their population controls. The unemployment rate ticked up 0.1 percentage points to 7.9%, those employed decreased by -110,000, another 117,000 people joined the ranks of the official unemployed and yet 167,000 more were considered not in the labor force at all.
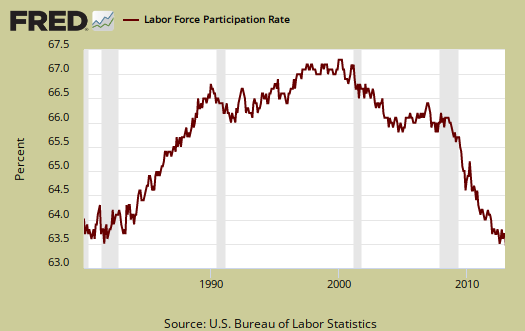
The labor participation rate stayed the same 63.6%. The labor participation rate is at artificial lows, where people needing a job are not being counted. No change isn't good actually for it means that those who dropped out of the labor force are staying out of the labor force. For those claiming the low labor participation rate is just people retired, we proved that false by analyzing labor participation rates by age.
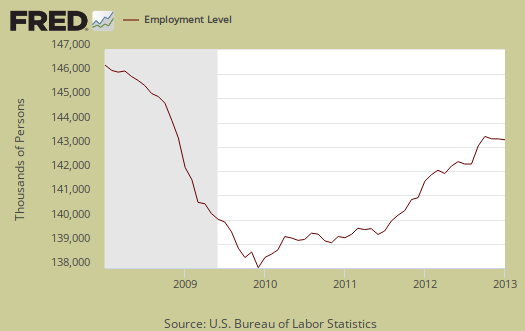
The number of employed people is now 143,322,000 employed people in the U.S. That is almost static in terms of labor flows, although this figure varies widely from month to month. Below is a graph of the Current Population Survey employed.
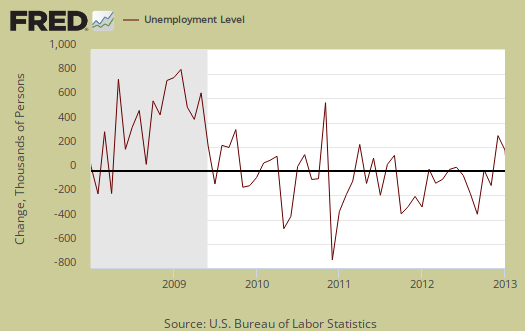
Those unemployed stands at 12,206,000. Below is the change in unemployed and as we can see, this number also swings wildly on a month to month basis, as we describe here and why you shouldn't use the CPS figures on a month to month basis to determine actual job growth. These are people employed not jobs.
Below is a graph of those considered employed, in maroon, scale on left, against those considered unemployed, in blue, scale on right, by the BLS methods. It is only recently that the growth rate of the employed has exceeded the growth rate of the unemployed (the maroon line exceeding the blue line).

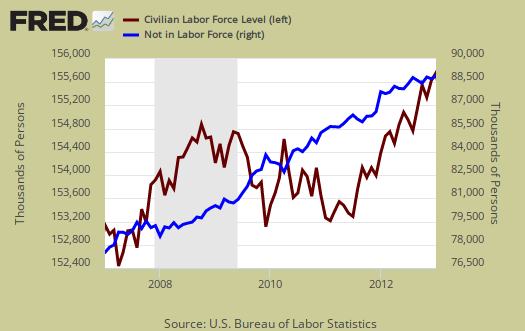
The civilian labor force is now 155,654,000. Notice in the graph below how many more people are in the labor force than at the start of the 2008 recession. Population increases every month and this post gives details on that increase, while this one describes BLS labor concepts as well as how many jobs are needed just to keep up with the increased population.

Those not in the labor force now tallies to 89,008,000. Below is the change to show on a month to month basis, the CPS shows quite a bit of variance. We talk about the wild monthly CPS changes in this post.

Below is a graph of the civilian labor force, in maroon, scale on left, against those not in the labor force, in blue, scale on right. What we see is a never ending growing segment of the population that is considered neither employed or unemployed.
Those considered employed as a ratio to the total Civilian noninstitutional population stands at 58.6%. Below is a graph since 1980 to show how low this ratio is. This implies there are many people who could be part of the labor force who are not anymore.
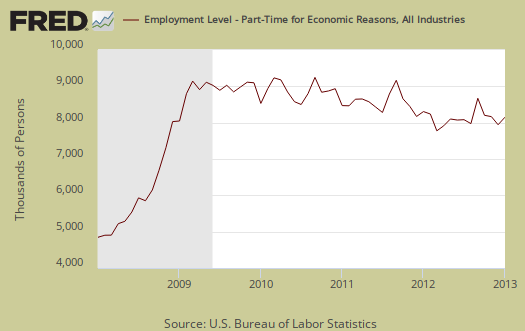
A huge problem with today's labor market is the gross number of working part-time generally. There is a huge number of people who need full-time jobs with benefits who can't get decent career oriented positions. Those forced into part time work is now 7,973,000, a hell of a lot of people stuck with part-time hours who need full-time work.
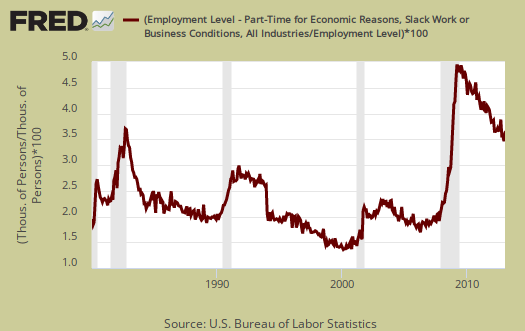
Below is a graph of forced into part-time because they got their hours cut as a percentage of the total employed. This is known as slack work conditions and was 5,126,000 people in January. . Below is a graph of forced part-timers due to slack work conditions as a percentage of the civilian labor force. We think this graph is a recession economic indicator, and notice the slope matches strongly the gray recession bars of the graph. The percentage of people in working part-time due to slack economic conditions has stayed extremely high since the start of the Great Recession.
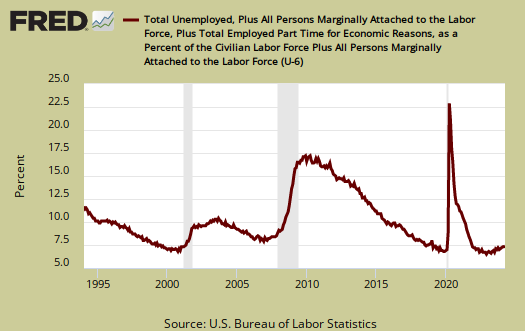
U-6 is a broader measure of unemployment and includes the official unemployed, people working part-time hours because that's all they can get and a subgroup not counted in the labor force but are available for work and looked in the last 12 months. Believe this or not, the U-6 alternative unemployment rate still leaves out some people wanting a job who are not considered part of the labor force. U-6 remained the same at 14.4%.
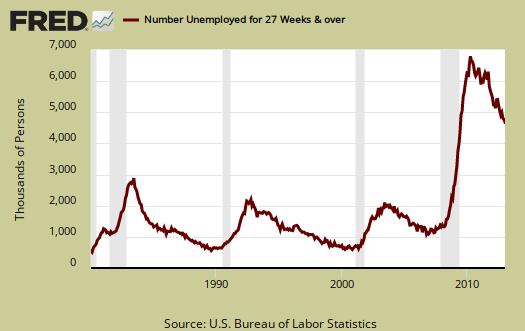
The long term unemployed, or those unemployed for 27 weeks and over, stand at the incredible figure of 4,708,000 people. The long term unemployed are the crisis of our time and this figure just isn't decreasing and they are getting hired. The long term unemployed are 38.1% of the total unemployed. The question is are these people no longer counted or did they find a job? Considering the jobs crisis has been going over for over half a decade we think the decline is more due to people no longer being counted as either employed or unemployed.
The marginally attached are people not in the labor force because they have not looked for a job in the last month, but have looked for a job in the last year. This number has ballooned since 2007 and not returned to pre-recession levels. The graph below is the number of people considered marginally attached to the labor force, currently at 2.443 million.
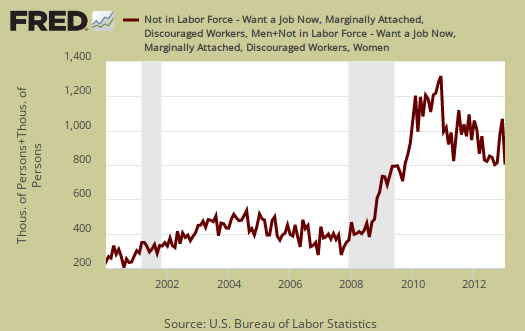
Discouraged workers are people, not counted as part of the civilian labor force, who not only want a job, but also looked for one in the last year. These people aren't job hunting now because they believe there are no jobs out there. Below is the graph of discouraged workers, currently at 804 thousand people and are a subset of the marginally attached. Discouraged workers is kind of a baramoter for how the job market is perceived.
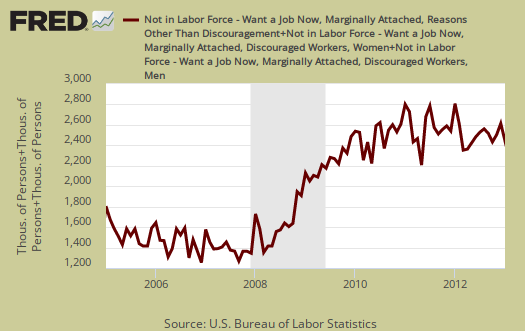
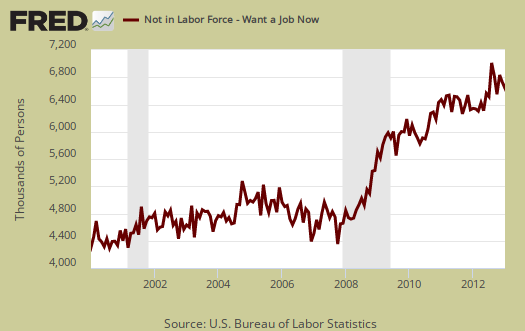
One of our favorite statistics from the CPS survey is how many people who are considered not in the labor force, want a job now. It is a direct survey question from the CPS. The survey asks people who are not being counted in the unemployment statistics and official unemployment rate if they want a job. The number who answer yes currently stands at 6,631,000. That's an astounding number of people not counted who report they actually want a job. This figure includes the discouraged workers and marginally attached, graphed above.
The average length of unemployment is now 35.3 weeks. The decline is a positive, assuming that is not due to people dropping out the labor force. It is still an absurdly long amount of time to be unemployed and has stayed highly elevated for years. The average duration is also so high due to the long-term unemployed, who clearly are having a hell of a time getting a job, many facing age discrimination.
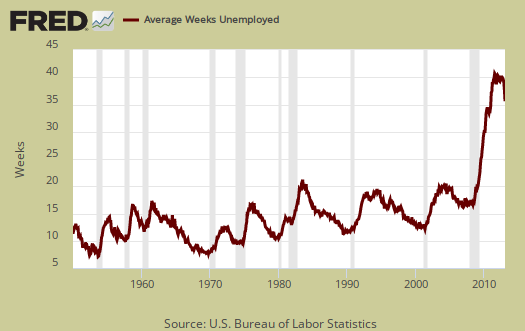
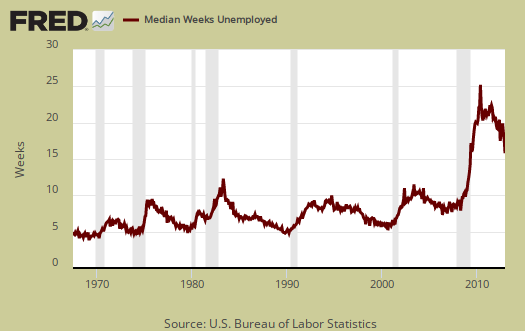
The median time one is unemployed, which means 50% of people have gotten a job in this amount of time, and is 16.0 weeks, a better signal in terms of finding a job.
Here is last month's overview of the CPS unemployment statistics. This article describes the annual adjustments to payrolls.
Duration of unemployment is way off
The labor participation rates and SNAP usage are just showing how dismal the situation is, that's what is really telling. We're looking at labor participation rates not seen since 1981. Given the lack of job creation (what are we looking at, maybe 150,000) there's no way median length of unemployment is 16 weeks. Especially with the 99ers now 1, 2, or 3 years past 99, median stats have to be way up there. There's also the claim by some that unemployment for people with BAs is somehow massively lower than those with only high school degrees. There are actually claims that the rate for BAs or BSs is somewhere around 3.6%. No way. In fact, people are finding that college degrees make them less likely to get hired in the healthcare and service jobs that now comprise the majority of "new jobs" in this NAFTA, CAFTA, TPP era in the US. These are just lies meant to get people to go into debt for useless degrees (in the sense that they don't help secure a job, not in the sense that the skills or knowledge are useless) in the hopes that they might get a leg up. Once they go into debt, the banksters own them and they are still unemployed.
Even reading the Huffington Post, which has been ardently in favor of Obama and Dems for a long time, people aren't buying into anything regarding jobs, job creation, unemployment stats, etc. from either party. People of most stripes (unless they simply refuse to think) realize that politicians just don't care. They serve the $. The politicians aren't unemployed, their friends and relatives will get rich no matter how lazy or idiotic they are, and the corrupt win. Nothing changes because they have no reason to change, they love the status quo.
By the way, Bill Clinton is still making the rounds around the country making speeches, attending politicians' funerals, etc. These people have no shame, they helped destroy the middle class in this country, and they still enjoy acting like the kings they think they are. Is Clinton or any other politician thinking about the suffering Americans unemployed or in crap jobs this week? Nope, they don't care, they are rich and that's all that matters to them, that and people stroking their egos.
16 weeks is four months for median duration
Four months is a long time to be without a paycheck. It does sound too low considering how bad the job market really is. I find the press ridiculous for even the official unemployment rate is way too high to be acting like this is over. More, for the last two years, the job additions are more close to maintaining population growth that really creating jobs.
I also agree, the politicians are completely corrupt and touting "middle class" when they helped destroy the middle class is most irritating. Probably one of the most offense things, to see rhetoric trying to claim up is down, black is white for U.S. labor. Both parties, when it comes to the regular people do this spin, seemingly in a race to perfect their propaganda as an agenda!
16 weeks is relatively not bad, 1-5+ years is BRUTAL
The job search without results (and literally thousands of times of complete silence) is crushing people out here. About.com and Gawker unemployment stories are great (in the sense of truth, not "great" because it's pure misery). It's a savage government that's turned its back on so many people as it serves the $, and the people with semi-decent to good gigs are merely hoping silence or just going along will spare them from unemployment (nope, no one's special, no one's skills are that great when penny pinching is all that matters). And for those in the federal government that think they can never be fired while enjoying six-figure salaries and are somehow special, those jobs aren't assured when the tax base amounts to a mere fraction of its former self - everyone will learn they are just a number on the ledger that can be cut when needed by the bonus seeking big dogs at the top.
I doubt there's one family out there that's not touched by long-term unemployment (outside political/plutocratic circles of course).
Imagine the millions of people that had small businesses go bankrupt, are contractors, temps, etc. that were never eligible for Day 1 of benefits. So where'd they all go and how fast did they wind up homeless? Because I don't see anyone talking about the millions of people in that boat other than them.
Nope, this country is being flushed down the sh**ter in the race to the bottom. And if people think it ends at Chinese wages, think again. Truly evil greedy bastards can replace anyone with slave or inmate labor in any hellhole around the world as long as quality doesn't matter and it's all about price. I'm training a secret army of parrots and sloths to replace Congress and every other politician. They are more honest, will listen to their constituents' concerns, smarter, and work much cheaper (I'm taking a lesson from the plutocrats). And being a good American, all of these sloths, parrots, and other creatures will also be American, because that will be the first step in ending this lunacy.
there is a complete disconnect
There is a complete disconnect between D.C., Wall Street and real life in America economically. The reason, in part, Federal government jobs have way better benefits, retirement, wages is due to unions. There are more unionized workers whereas the private sector unions have been decimated. It matters, it really does for job security. Federal workers shouldn't be chastised for keeping good jobs, more the private sector should be condemned for their never ending race to the bottom on wages, labor, jobs, benefits and retirement. They squeeze workers to improve their quarterly profit statements and make sure their executives get multi-million dollar bonuses.