
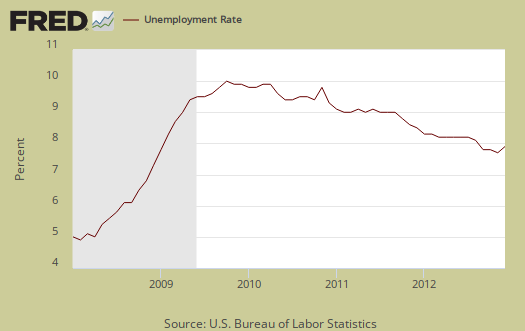
The BLS employment report shows a 7.8% unemployment rate for December. November was revised up from a 7.7% to 7.8% unemployment rate, but due to a change in the BLS annual seasonal adjustment revisions. This article overviews the statistics from the Current Population Survey of the employment report and the words to describe December are little change.
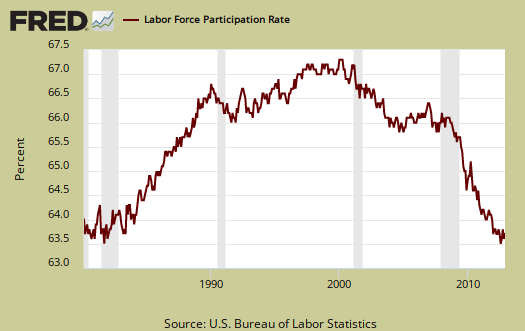
The labor participation rate stayed the same 63.6%. The labor participation rate is at artificial lows, where people needing a job are not being counted. No change isn't good actually for it means that those who dropped out of the labor force are staying out of the labor force. For those claiming the low labor participation rate is just people retired, we proved that false by analyzing labor participation rates by age.
The number of employed increased by 28,000 in a month to a total of 143,305,000 employed people in the U.S. That is almost static in terms of labor flows, although this figure varies widely from month to month. Below is a graph of the Current Population Survey employed.

Those unemployed increased by 164,000 to a new level of 12,206,000. Below is the change in unemployed and as we can see, this number also swings wildly on a month to month basis, as we describe here and why you shouldn't use the CPS figures on a month to month basis to determine actual job growth.

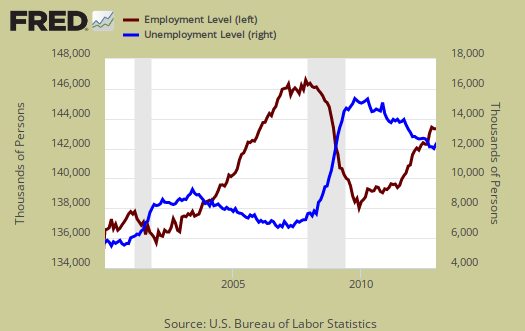
Below is a graph of those considered employed, in maroon, scale on left, against those considered unemployed, in blue, scale on right, by the BLS methods. It is only recently that the growth rate of the employed has exceeded the growth rate of the unemployed (the maroon line exceeding the blue line).
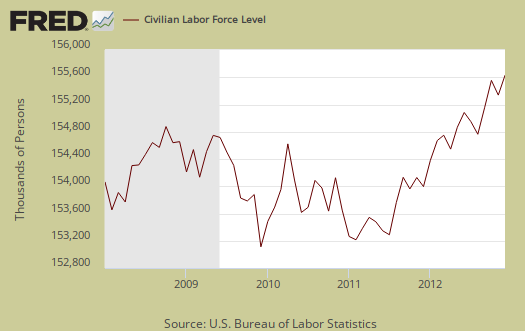
The civilian labor force also increased by 192,000 to 155,511,000. Notice in the graph below how many more people are in the labor force than at the start of the 2008 recession. Population increases every month and this post gives details on that increase, while this one describes BLS labor concepts as well as how many jobs are needed just to keep up with the increased population.
Those not in the labor force barely declined by -16,000 to 88,839,000. This means last month's labor force drop out of over half a million people stayed the same for December. Below is the change to show on a month to month basis, the CPS shows quite a bit of variance. We talk about the wild monthly CPS changes in this post.
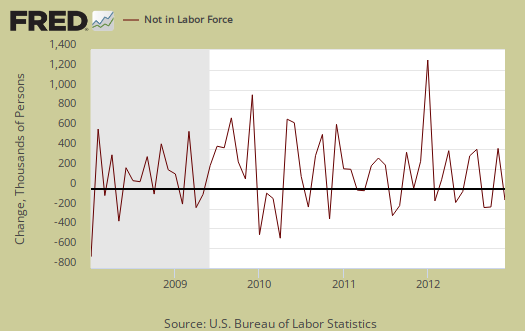
Below is a graph of the civilian labor force, in maroon, scale on left, against those not in the labor force, in blue, scale on right. What we see is a never ending growing segment of the population that is considered neither employed or unemployed.

Those considered employed as a ratio to the total Civilian noninstitutional population decreased by -0.1 percentage points to stand at 58.6%. Below is a graph since 1980 to show how low this ratio is. This implies there are many people who could be part of the labor force who are not anymore.
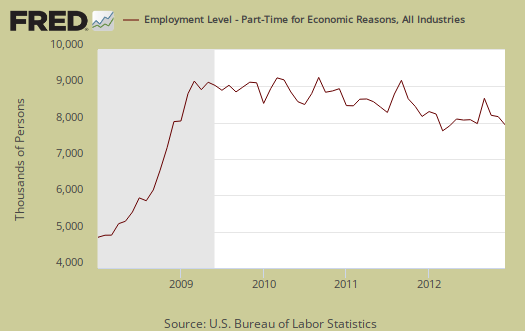
A huge problem with today's labor market is the gross number of working part-time generally. There is a huge number of people who need full-time jobs with benefits who can't get decent career oriented positions. Those forced into part time work decreased by -220 thousand to 7,918,000. While still a hell of a lot of people stuck with part-time hours who need full-time work, a decrease in this figure over time is better news for labor and the 2nd month in a row.
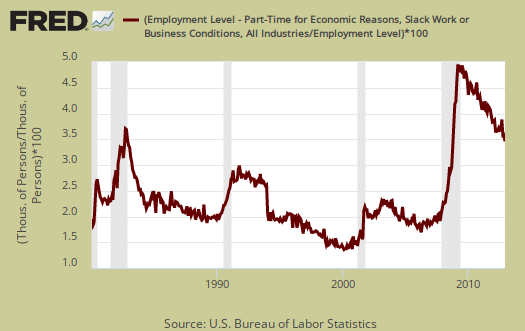
Below is a graph of forced into part-time because they got their hours cut as a percentage of the total employed. This is known as slack work conditions and dropped by -156,000 people in December. Below is a graph of forced part-timers due to slack work conditions as a percentage of the civilian labor force. We think this graph is a recession economic indicator, and notice the slope matches strongly the gray recession bars of the graph. The percentage of people in working part-time due to slack economic conditions has stayed extremely high since the start of the Great Recession, even while declining the last three months in a row, which is a good sign.
U-6 is a broader measure of unemployment and includes the official unemployed, people working part-time hours because that's all they can get and a subgroup not counted in the labor force but are available for work and looked in the last 12 months. Believe this or not, the U-6 alternative unemployment rate still leaves out some people wanting a job who are not considered part of the labor force. U-6 remained the same at 14.4%.

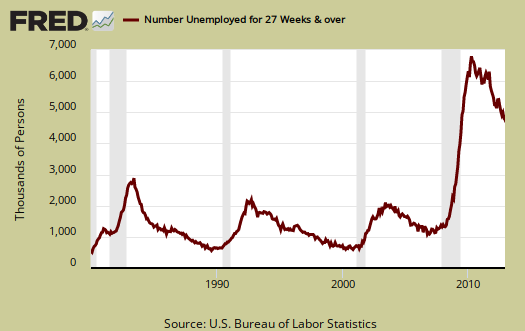
The long term unemployed, or those unemployed for 27 weeks and over, declined by -18 thousand to a still incredible figure of 4,766,000 people. The long term unemployed are the crisis of our time and this figure just isn't decreasing and they are getting hired. The long term unemployed are 39.1% of the total unemployed, a -0.9 percentage point decline from last month. The question is are these people no longer counted or did they find a job? We think the former is more probable.
The marginally attached are people not in the labor force because they have not looked for a job in the last month, but have looked for a job in the last year. This number has ballooned since 2007 and not returned to pre-recession levels. The graph below is the number of people considered marginally attached to the labor force, currently at 2.614 million.
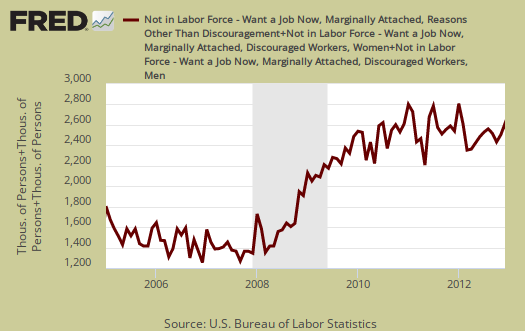
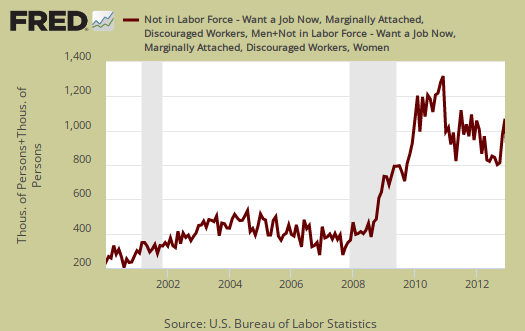
Discouraged workers are people, not counted as part of the civilian labor force, who not only want a job, but also looked for one in the last year. These people aren't job hunting now because they believe there are no jobs out there. Below is the graph of discouraged workers, currently at 1.068 million people and are a subset of the marginally attached.
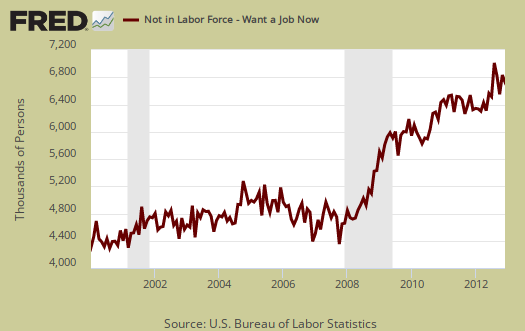
One of our favorite statistics from the CPS survey is how many people who are considered not in the labor force, want a job now. It is a direct survey question from the CPS. The survey asks people who are not being counted in the unemployment statistics and official unemployment rate if they want a job. The number who answered yes currently stands at 6,750,000 and decreased -77 thousand from last month. That's an astounding number of people not counted who report they actually want a job. This figure includes the discouraged workers and marginally attached, graphed above.
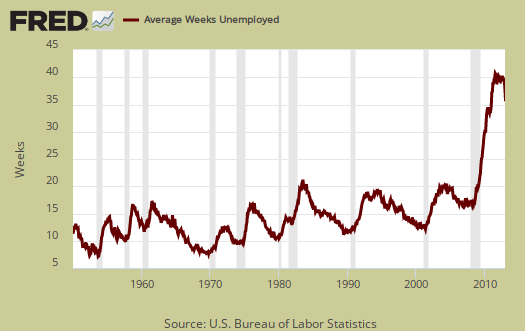
The average length of unemployment decreased from 39.7 weeks to 38.1 weeks, which is a positive sign, assuming that is not due to people dropping out the labor force. It is still an absurdly long amount of time to be unemployed. The average duration is also so high due to the long-term unemployed.
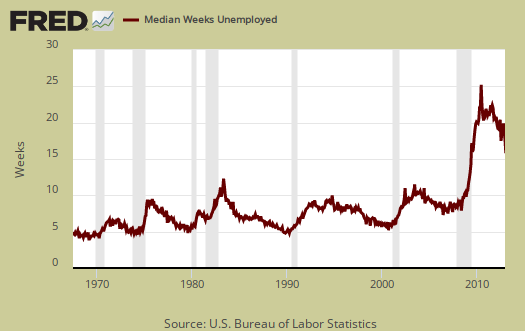
The median time one is unemployed, which means 50% of people have gotten a job in this amount of time, and decreased significantly from 18.9 to 18.0 weeks, a better signal in terms of finding a job.
Here is last month's overview of the CPS unemployment statistics. We'll be reviewing payrolls and other employment figures in additional articles.
Recent comments