
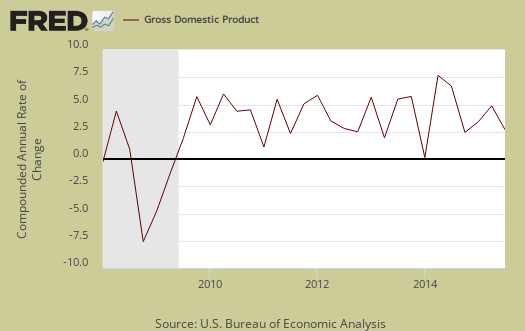
The initial Q3 GDP estimate is a not very enticing 1.5%. Consumer spending was still relatively healthy but the contraction in inventories change eradicated 1.44 points of economic growth. Imports and exports somewhat negated each other. Government contributed a small amount of growth to GDP.
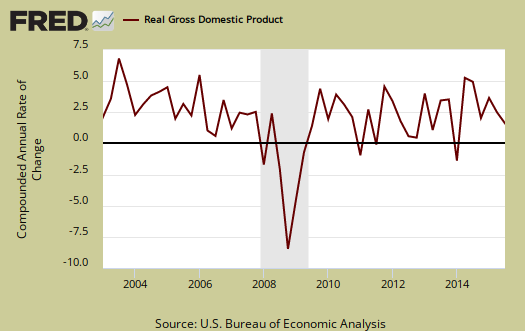
As a reminder, GDP is made up of: where Y=GDP, C=Consumption, I=Investment, G=Government Spending, (X-M)=Net Exports, X=Exports, M=Imports*. GDP in this overview, unless explicitly stated otherwise, refers to real GDP. Real GDP is in chained 2009 dollars.
The below table shows the GDP component comparison in percentage point spread from Q3 to Q2.
| Comparison of Q3 2015 and Q2 2015 GDP Components | |||
|---|---|---|---|
|
Component |
Q3 2015 |
Q2 2015 |
Spread |
| GDP | +1.49 | +3.91 | -2.42 |
| C | +2.19 | +2.42 | -0.23 |
| I | -0.97 | +0.85 | -1.82 |
| G | +0.30 | +0.46 | -0.16 |
| X | +0.24 | +0.64 | -0.40 |
| M | -0.27 | –0.46 | +0.19 |
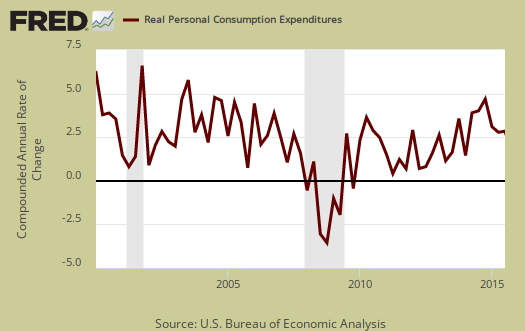
Consumer spending, C was fairly healthy with a 2.12 percentage point increase, although not as strong as Q2. Below is a percentage change graph in real consumer spending going back to 2000.
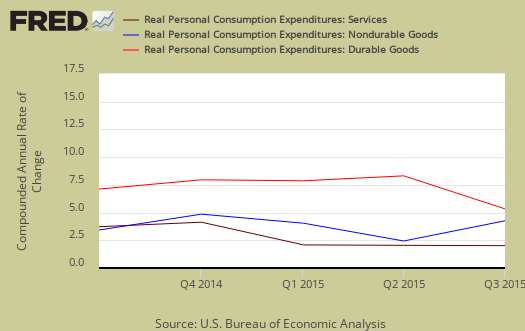
Goods contributed 0.99 percentage points to GDP and within goods, durables was 0.48 percentage points. Services was a 1.20 percentage point contribution. Graphed below is PCE with the quarterly annualized percentage change breakdown of durable goods (red or bright red), nondurable goods (blue) versus services (maroon).
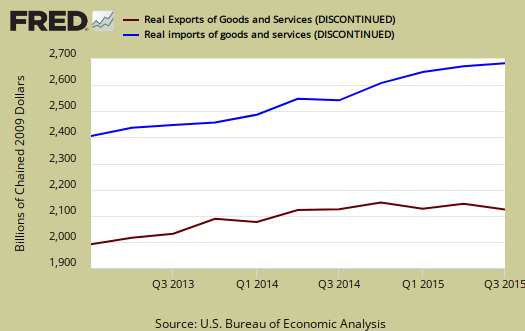
Imports and Exports, M & X were nil, a -0.3 percent point contribution. Trade activity looks halved but this is the advance GDP estimate. Actual trade data hasn't come in yet and imports are almost always revised upward.
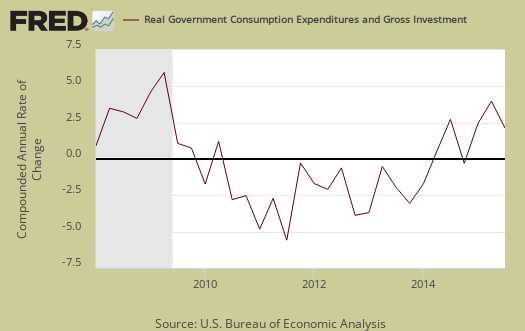
Government spending, G contributed 0.30 percentage points to Q3 GDP with almost all of it, 0.29 percentage points, contributed by state and local governments spending and investment.
Investment, I is made up of fixed investment and changes to private inventories. The change in private inventories alone was a horrific -1.44 percentage point contribution. Below are the change in real private inventories and the next graph is the change in that value from the previous quarter.


Fixed investment is residential and nonresidential and was 0.47 percentage points of GDP contribution. Nonresidential was a 0.27 individual percentage point contribution.

Residential fixed investment was 0.20 percentage points to GDP. The below graph shows residential fixed investment.

Nominal GDP: In current dollars, not adjusted for prices, of the U.S. output,was $18,034.8 billion, a 2.7% annualized increase for Q3 from Q2. In Q2, current dollar GDP increased 6.1%, showing Q3 was quite less.
Real final sales of domestic product is GDP - inventories change. This figures gives a feel for real demand in the economy. This is because while private inventories represent economic activity, the stuff is sitting on the shelf, it's not demanded or sold. Real final sales increased 3.2%.

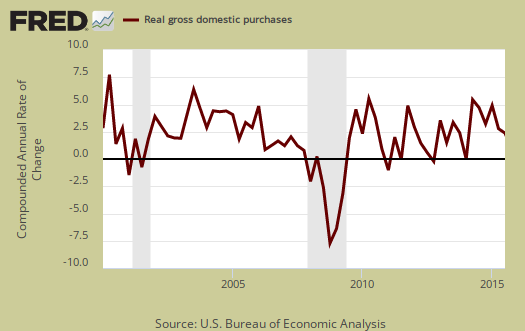
Gross domestic purchases are what U.S. consumers bought no matter whether it was made in Ohio or China. It's defined as GDP plus imports and minus exports or using our above equation: where P = Real gross domestic purchases. Real gross domestic purchases increased 1.5% in Q3. Exports are subtracted off because they are not available for purchase by Americans, but imports are available for purchase in the U.S. When gross domestic purchases exceed GDP, that's actually bad news, it means America is buying imports instead of goods made domestically. Notice this quarter they are equal.
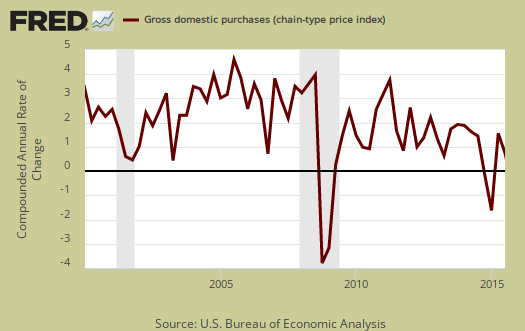
The price index for gross domestic purchases increased 1.5% for Q3. Without food and energy considered, the core price index increased 1.6%. This is about the same as Q2, 1.4% and below the Federal Reserve's target inflation rate. Below is the price index for gross domestic purchases.
Below are the percentage changes of the Q3 2015 GDP components, from Q2. The thing to notice is how exports improved for Q2. There is a difference between percentage change and percentage point change. Point change adds up to the total GDP percentage change and is reported above. The below is the individual quarterly percentage change, against themselves, of each component which makes up overall GDP. Additionally these changes are seasonally adjusted and reported by the BEA in annualized format.
|
Q3 2015 GDP Component Percentage Change (annualized) |
|||
|---|---|---|---|
| Component | Percentage Change from Q2 | ||
| GDP | +1.5% | ||
| C | +3.2% | ||
| I | -5.6% | ||
| G | +1.7% | ||
| X | +1.9% | ||
| M | +1.8% | ||
Overall this GDP report implies some bad news with contracting inventories in terms of economic growth. Contracting inventories implies businesses are not expecting a surge of new business. Yet consumer spending was on par with last quarter and other GDP elements stood out as steady as she goes components. It will be another thing entirely if there are significant revisions to imports, yet from the global slowing and trade reports, it is not expected to see an import surge.
Other overviews on gross domestic product can be found here. The BEA GDP site is here.
clarification. 3rd qtr inventories increased
i've been all over the web - WSJ, Reuters, AP - complaining about how growth of inventories was described...everyone reported they were down; they werent...they grew by an inflation adjusted $56.8 billion in the 3rd quarter, half the pace they grew in the 2nd quarter…so they added to nominal GDP, but subtracted from the GDP growth rate, which measures the change in the growth of inventories…
rjs
if that is not clear
it is changes, rate of change of private inventories in GDP, which in turn is change, the rate of growth.
I try to amplify that but I really should create my own 2nd derivative graph since none exist.