
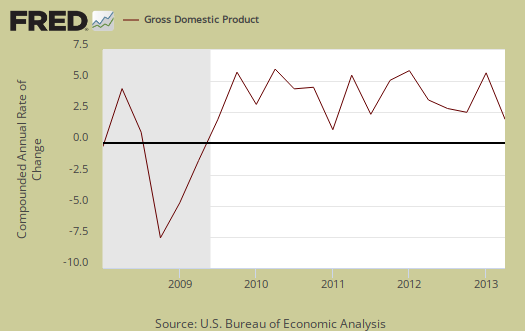
Q2 2013 real GDP came in at 1.7% Q1 GDP was revised down to 1.1%. Government spending declines were much less of a drag on the economy than Q1 while imports sucked out -1.51 percentage points of economic growth. Exports did recover but were about half of what imports subtracted from GDP. Investment grew on across the board increases. Consumer spending decreased slightly from Q1. Generally speaking 1.7% GDP implies fairly weak economic growth, the third quarter in a row for GDP below 2.0%.

As a reminder, GDP is made up of: where Y=GDP, C=Consumption, I=Investment, G=Government Spending, (X-M)=Net Exports, X=Exports, M=Imports*.
The below table shows the percentage point spread breakdown from Q1 to Q2 GDP major components. GDP percentage point component contributions are calculated individually.
| Comparison of Q1 2013 and Q2 2013 GDP Components | |||
|---|---|---|---|
|
Component |
Q1 2013 |
Q2 2013 |
Spread |
| GDP | +1.15 | +1.68 | +0.53 |
| C | +1.54 | +1.22 | -0.32 |
| I | +0.71 | +1.34 | +0.63 |
| G | –0.82 | –0.08 | +0.74 |
| X | –0.18 | +0.71 | +0.89 |
| M | –0.10 | –1.51 | -1.41 |
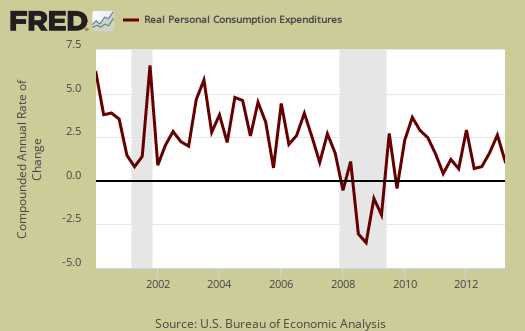
Consumer spending, C in our GDP equation, shows less growth than Q1. In terms of percentage changes, real consumer spending increased 1.8% in Q2 in comparison to a 2.3% increase in Q1. Increases were evenly spread with services adding a 0.43 percentage point contribution and goods showing a 0.79 percentage point contribution to PCE. Durable goods consumer spending contributed 0.48 percentage points to personal consumption expenditures. Below is a percentage change graph in real consumer spending going back to 2000.
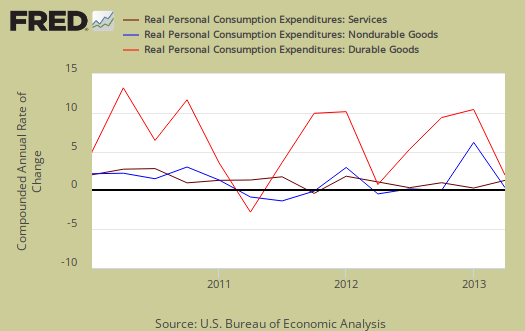
Graphed below is PCE with the quarterly annualized percentage change breakdown of durable goods (red or bright red), nondurable goods (blue) versus services (maroon).
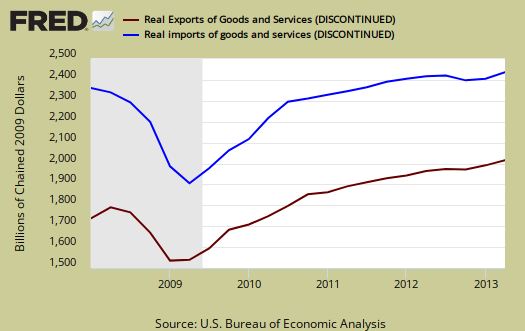
Imports and Exports, M & X subtracted –0.81 percentage points to Q2 GDP as imports soared from Q1 . Import services, which includes offshore outsourcing, were -0.22 percentage points and imported goods subtracted -1.29 percentage points from GDP. The U.S. also exported 0.22 percentage points worth of services, so the two canceled each other out in Q2. The below graph shows real imports vs. exports in billions. The break down of the GDP percentage change to point contributions gives a clear picture on how much the trade deficit harms U.S. economic growth.
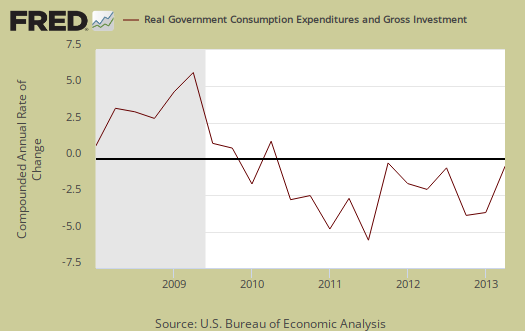
Government spending, G was –0.08 percentage points of Q2's GDP, a -0.4% percentage decline from Q1. It looks like the national defense spending rout is over, with just another –0.5% drop for Q2, after two quarters of implosion. State and local governments actually increased spending and added 0.04 percentage points from Q2 GDP. Below is the percentage quarterly change of government spending, adjusted for prices, annualized.
Investment, I is made up of fixed investment and changes to private inventories. The change in private inventories alone gave a +0.41 percentage point contribution to Q2. Changes in private inventories were less than Q1 as farm inventories returned to a more normal contribution level, 0.13 percentage points. Below are the change in real private inventories and the next graph is the change in that value from the previous quarter.


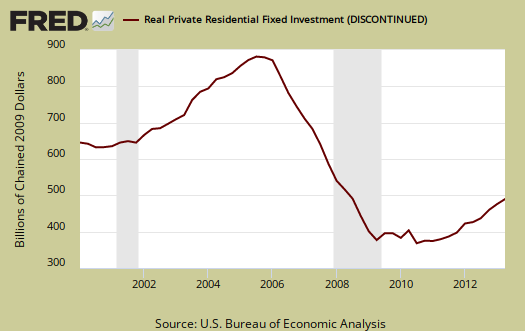
Fixed investment is residential and nonresidential and is a bright spot in the Q2 GDP report, as it was in Q1. Overall, fixed investment contributed +0.93 percentage points to GDP.

Part of fixed investment is Residential fixed investment. Residential contributed +0.38 percentage points to Q2 GDP. One can see the housing bubble collapse in the below graph and also how there is no meteoric recovery in terms of economic growth, but a modest one, for the last two quarters, in spite of all of the housing talk . Nonresidential fixed investment added 0.55 percentage points but this is in part due to the addition of intellectual property into GDP calculations.
The price index for gross domestic purchases, was 0.3% for Q2 in comparison to 1.2% for Q1. This means there was less inflation in comparison to last quarter. Since the price index is used to remove inflation from GDP to obtain real growth, less inflation means less price increases to eat away at economic growth. The core price index, or prices excluding food and energy products, was 0.8%,an decrease of -0.6 percentage points from Q1 .
Nominal GDP: In current dollars, not adjusted for prices, of the U.S. output,was $16,633.4 billion, an 2.4% increase from Q1. In Q1, current dollar GDP increased 2.8%. All figures are annualized.
Real final sales of domestic product is GDP - inventories change. This gives a better feel for real demand in the economy. This is because while private inventories represent economic activity, the stuff is sitting on the shelf, it's not demanded or sold. Real final sales increased 1.3% for Q2, which reflects weak demand. Q1 real final sales were basically flat, only a 0.2% increase.

Below are the percentage changes of Q2 2013 GDP components, from Q1. There is a difference between percentage change and percentage point change. Point change adds up to the total GDP percentage change and is reported above. The below is the individual quarterly percentage change, against themselves, of each component which makes up overall GDP. Additionally these changes are seasonally adjusted and reported by the BEA in annualized format.
|
Q2 2013 Component Percentage Change (annualized) |
|||
|---|---|---|---|
| Component | Q2 Percentage Change From Q1 2013 | ||
| GDP | +1.7% | ||
| C | +1.8% | ||
| I | +9.0% | ||
| G | –0.4% | ||
| X | +5.4% | ||
| M | +9.5% | ||
The BEA's comparisons in percentage change breakdown of 4th quarter GDP components are below. Changes to private inventories is a component of I.
C: Real personal consumption expenditures increased 1.8 percent in the secondquarter, compared with an increase of 2.3 percent in the first. Durable goods increased 6.5 percent, compared with an increase of 5.8 percent. Nondurable goods increased 2.0 percent, compared with an increase of 2.7 percent. Services increased 0.9 percent, compared with an increase of 1.5 percent.
I: Real nonresidential fixed investment increased 4.6 percent in the second quarter, in contrast to a decrease of 4.6 percent in the first. Nonresidential structures increased 6.8 percent, in contrast to a decrease of 25.7 percent. Equipment increased 4.1 percent, compared with an increase of 1.6 percent. Intellectual property products increased 3.8 percent, compared with an increase of 3.7 percent. Real residential fixed investment increased 13.4 percent, compared with an increase of 12.5 percent.
X & M: Real exports of goods and services increased 5.4 percent in the second quarter, in contrast to a decrease of 1.3 percent in the first. Real imports of goods and services increased 9.5 percent, compared with an increase of 0.6 percent.
G: Real federal government consumption expenditures and gross investment decreased 1.5 percent in the second quarter, compared with a decrease of 8.4 percent in the first. National defense decreased 0.5 percent, compared with a decrease of 11.2 percent. Nondefense decreased 3.2 percent, compared with a decrease of 3.6 percent. Real state and local government consumption expenditures and gross investment increased 0.3 percent, in contrast to a decrease of 1.3 percent.
Other overviews on gross domestic product can be found here.
major changes to GDP, overview coming
This overview is just a straight data overview. We hope to look at revisions and more importantly what is now missing and what is added. Intuitively intellectual property bundled in SPVs in the Caymans, hmmm, now how is that really adding to America's economic growth?
im missing something...
why dont the seasonally adjusted annualized dollar changes match the seasonally adjusted annualized percentage changes?
im referring to Table 3A. Gross Domestic Product and Related Measures—p38 http://www.bea.gov/newsreleases/national/gdp/2013/pdf/gdp2q13_adv.pdf
for instance, seasonally adjusted spending for non-durable goods appears to have dropped from $2,607.0 billion in the 1st quarter to $2,593.2 billion in Q2, whereas it's given as a 2.0% rate of increase...both the rate of increase and the dollar amount are SAAR...
rjs
chained 2009 vs. nominal
Oops, edited this comment. Ok, you're referencing nominal (I think, although I didn't match up all of the figures).
If I go to:
On the new GDP release with the revision tables, p. table 3B, p. 44, line 9, nondurable goods, Q2 2013 and calculate annualized percentages I get a 2.0% change from Q1.
Calculation:
(2,333.7/2,322.2)^4 - 1 = 0.0199564 * 100 = 2.0% rounded
There are massive changes and I hope to get a 1st pass overview on them over the weekend. 2009 was deflationary, so I don't know about using chained price indexes from that year, it's a weird year.
Then, I'm none too impressed with this idea that a bunch of patents bundled up into special purpose vehicles located in the Caymans, how exactly that adds to domestic economic growth. Seems the only ones who add to domestic growth are patent attorneys in their various legal IP wars.
Then, it sure looks like motor vehicles as a GDP component is off the table, what is this...
they are offshore outsourcing our manufacturing base so gee, we'll just not count it anymore?
Anywho, I have to dig deep into their revision and new methods information so hopefully this weekend. Tomorrow is employment day, so we'll be looking at that all day.
ok, i see what they did
ok, i see what they did to arrive at the percentage increases; it strikes me as an odd way to compute changes, and, as you say, its an odd year to base your chained price index on...
on that chained basis, our GDP sits at $15,648.7 billion, so it's hard for me to relate the component figures of that to present day dollars..
rjs
hmm...Fed policy based on PCE inflation
just took a look at income and outlays released this morning from the BEA; http://www.bea.gov/newsreleases/national/pi/2013/pi0613.htm
it's also been rebenchmarked to 2009...PCE inflation for June reduced incomes and spending by 0.4% in chained 2009 dollars...
i plan on covering this...
rjs
revised farm inventories
with the latest revision, the first quarter only grew at a 1.1% rate, and .88% of that was growth in farm inventories, increased from the originally reported .83%...without those bin-busting winter silos, headline 1st quarter GDP growth would have printed +0.2% annualized..
another increase in farm inventories also accounted for .13% of the 1.7% 2nd quarter GDP growth...
there's usually payback for inventory induced GDP increases..
rjs
farm inventories, payback
That's true, and GDP has been riding inventories for a while now, although the contraction seems to highly correlate to recessions.
This is going to take us some real digging on the new methodology. Been in the works for months, but my thing is hmmmm, "don't like the numbers so change them"? Similarly to how CPI is calculated?
Is that what is going on? Cannot state that without well deep analysis but IP, really bothers me since production is offshore outsourced and the patents themselves sit in SPVs offshore. TBD!