
The Federal Reserve's Factory Production report shows a 0.0%, no change for October 2010 in Industrial Production. Here is a detailed report. It's not as bad as it sounds, manufacturing output itself increased and utilities dragged the index down. High temperatures are blamed for the drop in utilities, but myself, I cannot help but wonder if less people can afford them?
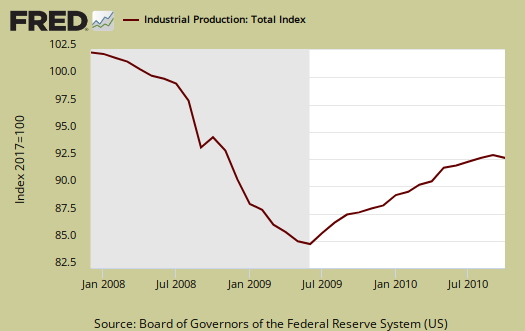
Look at the graphs and the actual reports from the Federal Reserve, not the press. Take this piece of news from the report below. That's not a V recovery when one is still below pre-recession levels.
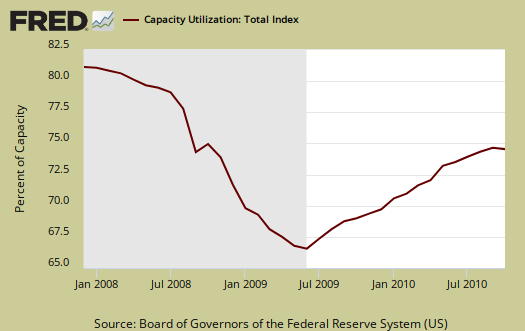
At 93.4 percent of its 2007 average, total industrial production in October was 5.3 percent above its year-earlier level. The capacity utilization rate for total industry was flat at 74.8 percent, a rate 6.6 percentage points above the low in June 2009 and 5.8 percentage points below its average from 1972 to 2009.
Major industry groups breakdown of industrial production.
- manufacturing: +0.5%
- mining: -0.1%
- utilities: -3.4%
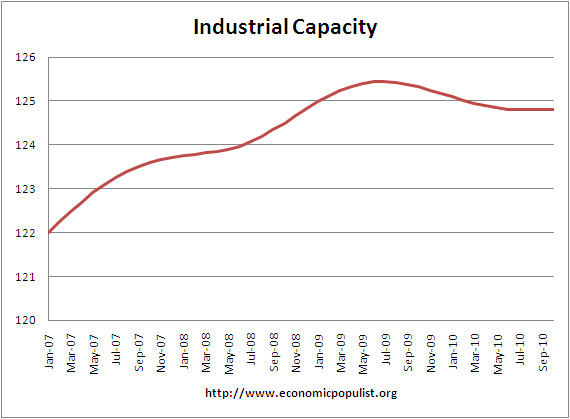
Below is the graph of total raw capacity, indexed against 2007. This is just how much capacity does the U.S. have to make stuff. Not just how much is the United States production facilities utilizing, but what is it's potential? Look at how damn flat this is in terms of just raw facilities, ability to produce. Utilization is a ratio, where raw capacity is the underlying number by which utilization is calculated. You can see it's flat, not growing. Where are the plants being built? China? India? Brazil? Manufacturing capacity, a subset of total capacity, has been unchanged, had a movement to 125.6 after being at 125.5 for 6 months. There was a +0.8 percentage change in selected high technology raw capacity for the month.
Nothing stands out beyond sluggishness for the below, except consumer durable goods increased 0.8% from the industrial production marketing group major changes(monthly rate), yet contained within final products and nonindustrial supplies, energy dropped -3.2%. Energy products are part of consumer goods (a final product), nonindustrial supplies, and materials. I literally emailed the Federal Reserve for clarification and they emailed the details here. I guess for this report, we might look at energy as a depressor.
- Final Products: +0.5%
- Consumer goods: 0.0%
- Business equipment: +1.1%
- Nonindustrial supplies: -0.5%
- Construction: +0.2%
- Materials: -0.1%
Below is industrial production since September 1990, indexed to that month. Look at the slope, the growth through the 1990's and then compare to 2000 decade. It was in 2000 when the China trade agreement kicked in and labor arbitrage of engineers, advanced R&D started.

Capacity utilization, or of raw capacity, how much is being used, was unchanged from last month's 74.8%. Below are capacity utilization's monthly percent change breakdown.
- manufacturing: +0.4%
- durable: +0.5%
- non-durable: +0.2%
- mining: -0.1%
- utilities: -2.8%
- selected high-technology industries: -0.4%
- crude: +0.1%
- primary: -0.5%
- finished: +0.5%
The below graphs show the overall decline of U.S. capacity utilization. Capacity utilization is how much can we make vs. how much are we using. These graphs show the U.S. is simply not producing what it is capable of, a reflection of the output gap. Note, this index is normalized to a specific year, currently from most reports, the 2007 yearly average (see year in the graph). Therefore, one cannot take absolute values of capacity utilization, i.e. 80%, and claim this is an indicator of a healthy economy, for it all depends on what year capacity utilization is normalized to. One can take the slope, or change from the peak of a recession and determine recovery, but again, these percentages are relative, they are not absolute ratios to a static point in time. Also recall utilization is a percentage of real total capacity. Notice that total capacity in the United States has declined.
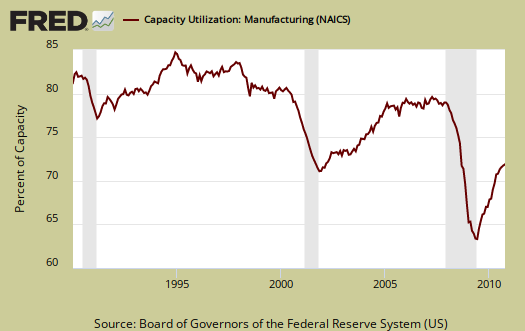
Below is the Manufacturing capacity utilization graph, normalized to 2007 raw capacity levels, going back to the 1990's. Too often the focus is on the monthly percent change, so it's important to compare capacity utilization to pre-recession levels and also when the economy was more humming.
Here are some more details on industrial production categories (market groups) from the Federal Reserve's report:
The output of consumer goods was unchanged in October. The production of consumer durables rose 0.8 percent. Within durables, the indexes for automotive products and for appliances, furniture, and carpeting each increased 1.1 percent. Gains in the production of miscellaneous goods and of home electronics were smaller, at 0.2 percent and 0.3 percent, respectively. The production of nondurable consumer goods declined 0.2 percent; a fall of 3.2 percent for the energy category, which primarily resulted from a decrease in the index for residential utilities, more than offset an increase of 0.7 percent for the non-energy category. Within non-energy nondurables, the index for clothing advanced 2.0 percent, and the indexes for foods and tobacco and for chemical products moved up at lesser rates; the index for paper products moved down.
The output of business equipment moved up 1.1 percent in October; it was 10.4 percent above its year-earlier level. The indexes for information processing equipment and for industrial and other equipment each advanced 1.2 percent, while the index for transit equipment rose 0.7 percent after two months of small declines.
In October, the index for defense and space equipment increased 0.7 percent and retraced most of its losses of the previous two months.
The production of construction supplies moved up 0.2 percent in October after having declined 0.4 percent in September. The index for business supplies decreased 0.8 percent in October; a decline of 3.2 percent in commercial energy products was partly offset by a gain of 0.2 percent in non-energy supplies.
The production of materials fell 0.1 percent in October. An increase in the output of durable materials, for which all major categories advanced, was offset by a small decline for nondurable materials and a somewhat larger decrease for energy materials. Within nondurable materials, the indexes for textiles and chemicals declined, and the index for paper advanced.
If you are baffled by what crude, finished mean, read these stages of production definitions.
Last month's overview of the Industrial Production economic report unrevised is here. The Federal Reserve releases detailed tables for more data, metrics not mentioned in this overview.
Recent comments