
The U.S. February 2016 monthly trade deficit increased 2.6% from last month and now stands at -$47.1 billion. America still runs a surplus in services, now at $17.7 billion, but the goods deficit is still massive and this month was -$64.7 billion. The U.S. trade deficit hasn't been this high since August 2015. This is in spite of petroleum imports being the lowest since September 2002. There are further bad signs from February's trade data. Imported foods, feeds and beverages was the highest on record while industrial supplies and materials exports hit a March 2010 low.

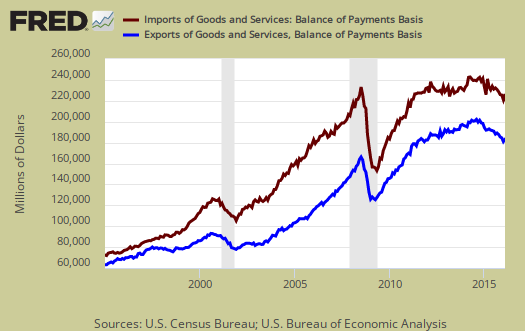
Graphed below are imports and exports graphed and by volume since 1995 and note the global trade collapse in 2009. For the month goods trade deficit increased by 1.4% while the services surplus shrank by -0.4%. Imports are in maroon and exports are shown in blue, both scaled to the left.
Below are the goods import monthly changes, seasonally adjusted. On a Census basis, overall imports increased by $2.719 billion to $183,331 billion as crude oil imports dropped by -$1.314 billion. Crude oil imports are now $6.707 billion. Consumer goods imports are off the charts as pharmaceutical preparations increased by $1.344 billion. Unreal, pharmaceutical preparations pretty much offset the dramatic -$1.3 billion decline in passenger car imports for the month.
- Industrial supplies and materials: -$0.948 billion
- Capital goods: +$0.998 billion
- Foods, feeds, and beverages: +$0.488 billion
- Automotive vehicles, parts, and engines: -$1.526 billion
- Consumer goods: +$3.596 billion
- Other goods: +$0.111 billion
Below is the list of good export monthly changes, seasonally adjusted, by end use and on a Census accounting basis, increased by +$1.885 billion to $1118.091 billion. Automotive and consumer goods led the increase as the U.S. exported $0.568 billion more in passenger cars and $0.629 billion more in gem diamonds.
- Automotive vehicles, parts, and engines: +$0.344 billion
- Industrial supplies and materials: -$0.179 billion
- Foods, feeds, and beverages: +$0.310 billion
- Capital goods: -$0.271 billion
- Consumer goods: +$1.064 billion
- Other goods: +$0.618 billion
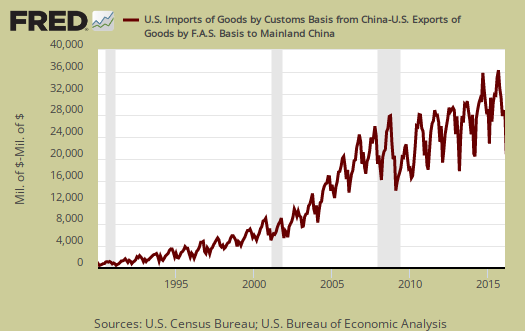
The China trade deficit is always the largest trade deficit and this month was a not seasonally adjusted -$28.112 billion China trade deficit The China trade deficit alone was 52% of the not seasonally total goods deficit, on a Census accounting basis. The annual 2015 the trade deficit with China was -$365.7 billion. The below graph shows how highly cyclical the monthly trade deficit with China is.
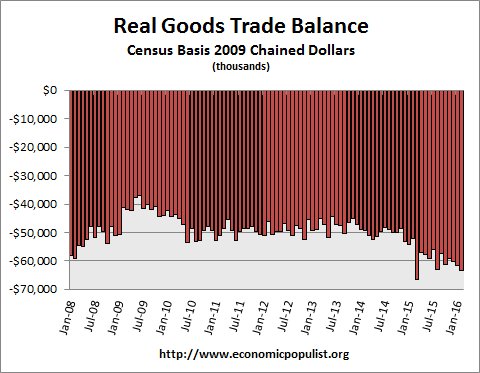
In real dollars, or adjusted for inflation, the goods trade deficit on a Census basis increased by -$1.575 billion to -$63.346 billion. The trade deficit continues to gobble up the U.S. economy. Real valued trade figures are part of GDP.
Oil or petroleum trade deficit has just plummeted and is now a monthly -$8.932 billion. That's just astounding. . Not seasonally adjusted a barrel of crude was $27.48 and barrels for the month were 214,729.
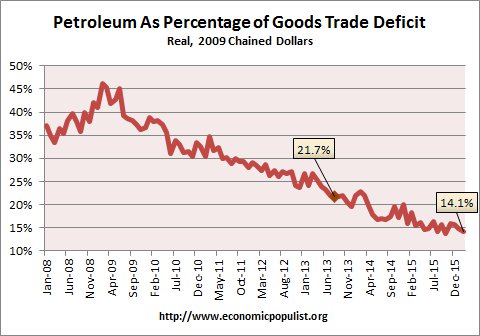
If we take the real valued end use of petroleum versus non-petroleum of the goods trade deficit, we see petroleum as a percentage of the trade deficit is plunging, which is great news. In November 2014 petroleum was only 14.1% of the real goods trade deficit. Real means the balance figures are adjusted prices using chained 2009 dollars so inflation is not in the mix. Below is a graph of petroleum end use deficit as a percentage of the goods trade balance and this breakdown is by the Census accounting method and in 2009 chained dollars. What we see is domestic production in energy, along with the global collapse of demand has truly helped with the overall trade deficit, yet China imports more than take up the slack in continuing to send the U.S. economy abroad as we see from record deficits. Importing $10.722 in foods, feeds and beverages is downright scary. Do we really want to eat over $1.5 billion in imported seafood?
What can one say? These figures just illustrate the U.S. economy being shipped abroad while foreign imports flood the U.S. market. It continues unabated as usual. Here are other trade deficit overviews, data unrevised.
goods deficit on track to subtract 65 basis points from Q1 GDP
using the chained dollars figures provided by exhibit 10 in the pdf for this report, i computed that our QoQ decrease in exports over the 2 months we have data for would subtract about 0.40 percentage points from 1st quarter GDP.....in a similar manner, i found that the increase in imports over those two months would subtract another 0.25 percentage points from 1st quarter GDP....
rjs
March not out yet for GDP estimate
Did you duplicate February for March, for odds are this won't repeat.
my trade impact estimate
my estimate was based on the average of January and Februay trade in goods vis a vis Q4...if March repeats February, it would be about an 80 basis point hit to GDP
rjs