
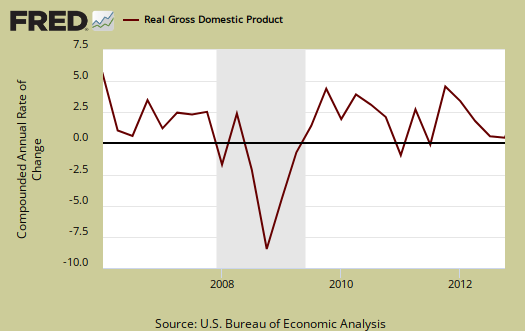
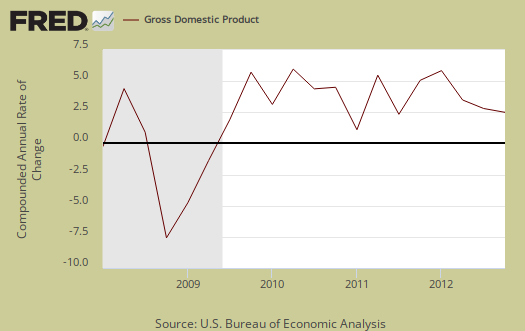
Q4 2012 real GDP contracted by -0.1%. Inventory investment nose dived, but was not the lone culprit for economic contraction. Exports plunged and took -0.81 real GDP percentage points along with it. Government spending cliff dove and hacked off -1.33 percentage points from 4th quarter real gross domestic product growth as federal defense spending declined 22.2% from Q3. Private inventory changes subtracted -1.27 percentage points from Q4 real GDP change and as a result of all this the economy went from expansion into contraction. A recession is defined as two consecutive quarters of negative GDP change. We're halfway there.
Consumer spending was really barely breathing in Q4 with a +1.52 percentage point contribution. Consumer spending seems like a bright spot, but that's actually low by percentage points, even though consumer spending did increase from Q3.. Real imports also contracted and thus increased Q4 GDP. Be warned for imports are almost always revised upward in the next GDP revision estimate.
As a reminder, GDP is made up of: where Y=GDP, C=Consumption, I=Investment, G=Government Spending, (X-M)=Net Exports, X=Exports, M=Imports*.
The below table shows the percentage point spread breakdown from Q3 to Q4 GDP major components. GDP percentage point component contributions are calculated individually.
| Comparison of Q3 2012 and Q4 2012 GDP Components | |||
|---|---|---|---|
|
Component |
Q3 2012 |
Q4 2012 |
Spread |
| GDP | +3.10 | -0.14 | -3.24 |
| C | +1.12 | +1.52 | +0.40 |
| I | +0.85 | –0.08 | -0.93 |
| G | +0.75 | –1.33 | -2.08 |
| X | +0.27 | –0.81 | -1.08 |
| M | +0.11 | +0.56 | +0.45 |
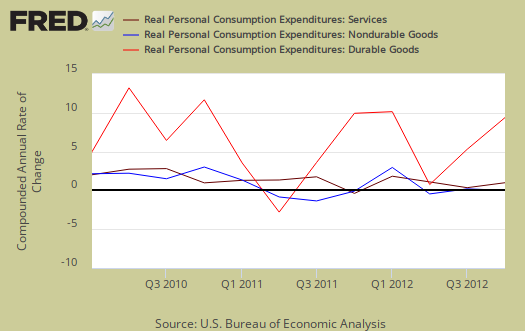
Consumer spending, C in our GDP equation, showed the only real increase from Q3. Durable goods consumer spending contributed a 1.02 percentage points to personal consumption expenditures. Motor vehicles & parts alone was a 0.62 percentage point contribution. Services spending shows a 0.44 percentage point contribution to real GDP, yet housing and utilities subtracted –0.47 percentage points. These values have been adjusted for inflation so one cannot blame falling energy prices or decreased rent. Graphed below is PCE with the quarterly annualized percentage change breakdown of durable goods (red or bright red), nondurable goods (blue) versus services (maroon).
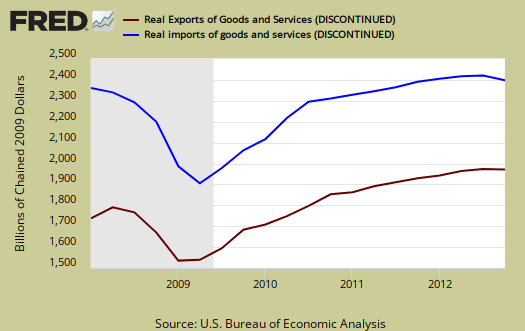
Imports and exports, M & X are greatly impacted by real values and adjustments for prices from overseas and they are usually revised again in the next estimate. Import growth in real dollars has slowed, thus adding to GDP growth, while exports contracted more than imports. The below graph shows real imports vs. exports in billions. The break down of the GDP percentage change to point contributions gives a clear picture on how much the trade deficit stunts U.S. economic growth.
Government spending, G was -1.33 percentage points of Q4's -0.14% GDP contraction. This was all federal spending, and of that Federal –1.25 percentage point GDP contribution, –1.28 of it was national defense. The DoD did prepare for sequestration as the fiscal cliff approached, but there iwas no announcement of any cuts being put into effect. That said, the decline in defense spending is not a one time thing as budget cuts for the department of defense have already been announced.
State and local governments subtracted -0.08 percentage points from Q4 GDP. Local and state governments are still hurting and contracting in their expenditures. Below is the percentage quarterly change of government spending, adjusted for prices, annualized.

Investment, I is made up of fixed investment and changes to private inventories. The change in private inventories alone gave a –1.27 percentage point contribution to Q4 GDP. Below are the change in real private inventories and the next graph is the change in that value from the previous quarter.


The drought is over as farm inventories added 0.11 percentage points to real GDP. .This was businesses contracting their inventories, which is a very bad sign on how much demand they see for their products in the future. Non-farm changes in inventories hacked off –1.37 percentage points from Q4 GDP growth and this reducing inventories on hand for industry can be blamed for Q4's contraction. The question is was industry reacting to Congress and the never ending pushing the economy to the brink by bad policy or is this real demand and a lack thereof?
Fixed investment is residential and nonresidential and is a bright spot in the Q4 GDP report. Overall, fixed investment contributed +1.19 percentage points to GDP. Residential fixed investment was +0.36 percentage point contribution to Q4 GDP. One can see the housing bubble collapse in the below graph and also how there is no meteoric recovery for Q4, in spite of all of the housing data hype. What's happening is there is activity in residential real estate but by volume has not returned to the housing bubble years, which frankly one doesn't want to return to a housing bubble to claim the economy is growing.

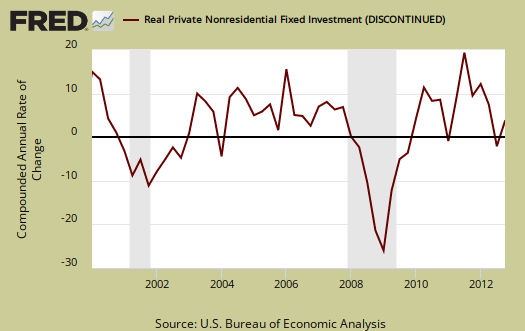
Nonresidential fixed investment was even better and gave a +0.83 percentage point contribution to Q4 real GDP. Equipment and software was a +0.86 GDP percentage point contribution while structures subtracted -0.03 percentage points from GDP.
Motor Vehicles as a whole was 0.04 percentage points of Q4 real GDP. Computer final sales, contributed to GDP by 0.15 percentage points. These categories are different from personal consumption, or C sub-components, such as auto & parts. These are overall separate indices to show how much they added to GDP overall. Motor vehicles, computers are bought as investment, as fleets, in bulk, by the government, as well as part of consumer spending, government spending and so on.
Overall services slammed GDP with a -0.78 percentage point contribution while goods, overall added +0.28 percentage points. Structures, overall, which is building activity, both residential and commercial and economic activity it generates, contributed +0.36 percentage points to Q4 real GDP.
The price index for gross domestic purchases, was 1.3% for Q4 in comparison to 1.4% for Q3. This means inflation was on par with last quarter. Core price index, or prices excluding food and energy products, was 1.1% .
Nominal GDP: In current dollars, not adjusted for prices, Q4 GDP, or the U.S. output, is $15.829 trillion, an 0.5% increase from Q3's $15.811 trillion . Applying the price indexes, or chained, real 2005 dollars, Q4 2012 GDP was $13.648 trillion. All figures are annualized.
Gross domestic purchases are what U.S. consumers bought no matter whether it was made in Ohio or China. It's defined as GDP plus imports and minus exports or using our above equation: where P = Real gross domestic purchases. Real gross domestic purchases only increased 0.1% in Q4 in comparison to a 2.6% increase in Q3. Exports are subtracted off because they are outta here, you can't buy 'em, but imports, as well a know all too well, are available for purchase at your local Walmart. When gross domestic purchases exceed GDP, that's actually bad news, it means America is buying imports instead of goods made domestically.
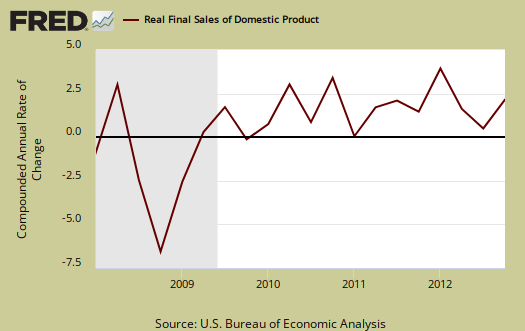
Real final sales of domestic product is GDP - inventories change. This gives a better feel for real demand in the economy. This is because while private inventories represent economic activity, the stuff is sitting on the shelf, it's not demanded or sold. Real final sales increased 1.1% for Q4, which reflects weak demand. Q3 real final sales increased 2.4%.
Below are the percentage changes of Q4 2012 GDP components, from Q3. There is a difference between percentage change and percentage point change. Point change adds up to the total GDP percentage change and is reported above. The below is the individual quarterly percentage change, against themselves, of each component which makes up overall GDP. Additionally these changes are seasonally adjusted and reported by the BEA in annualized format.
|
Q4 2012 Component Percentage Change (annualized) |
|||
|---|---|---|---|
| Component | Percentage Change from Q3 | ||
| GDP | –0.1% | ||
| C | +2.2% | ||
| I | –0.6% | ||
| G | –6.6% | ||
| X | –5.7% | ||
| M | –3.2% | ||
The BEA's comparisons in percentage change breakdown of 4th quarter GDP components are below. Changes to private inventories is a component of I.
C: Real personal consumption expenditures increased 2.2 percent in the fourth quarter, compared with an increase of 1.6 percent in the third. Durable goods increased 13.9 percent, compared with an increase of 8.9 percent. Nondurable goods increased 0.4 percent, compared with an increase of 1.2 percent. Services increased 0.9 percent, compared with an increase of 0.6 percent.
I: Real nonresidential fixed investment increased 8.4 percent in the fourth quarter, in contrast to a decrease of 1.8 percent in the third. Nonresidential structures decreased 1.1 percent; it was unchanged in the third quarter. Equipment and software increased 12.4 percent in the fourth quarter, in contrast to a decrease of 2.6 percent in the third. Real residential fixed investment increased 15.3 percent, compared with an increase of 13.5 percent.
X & M: Real exports of goods and services decreased 5.7 percent in the fourth quarter, in contrast to an increase of 1.9 percent in the third. Real imports of goods and services decreased 3.2 percent, compared with a decrease of 0.6 percent.
G: Real federal government consumption expenditures and gross investment decreased 15.0 percent in the fourth quarter, in contrast to an increase of 9.5 percent in the third. National defense decreased 22.2 percent, in contrast to an increase of 12.9 percent. Nondefense increased 1.4 percent, compared with an increase of 3.0 percent. Real state and local government consumption expenditures and gross investment decreased 0.7 percent, in contrast to an increase of 0.3 percent.
Here is our overview for Q3 GDP previous estimate and other reports on gross domestic product can be found here.
Do not dismiss the Q4 GDP numbers!
The press is cranking out articles on how today's GDP report is meaningless and oh gee, it's all good. That frankly is false. Now, one can point to the cuts in defense spending as preparation for the fiscal cliff cuts, but the reality is more cuts are coming so defense spending is projected to contract. As our Congress does lobbyists bidding instead of sane policy for the good of the nation, we will not get a focus on jobs (unless it is a pack of lobbyist lies claiming up is down and black is white).
That said, the figures in this report show weak demand and inventory contraction is usually an indicator of weak demand. There are problems through this report so read the facts and weep instead of the press spin claiming we all should ignore today's Q4 GDP contraction. I do not think so.
What if the sequester comes in next month?
Especially on top of the last quarter's defense cuts, if we are to see even larger cuts in defense how bad can GDP get? Some people project a 3.0% or worse drop. The Republicans may want to see that happen.
I read $500 billion in DoD cuts spread over 10 years
But since this is part of the "let's delay and focus on the deficit instead of jobs and growth"
that figure may change.
I saw another report stating $604 billion, so need to dig out some official numbers and sure didn't find them. One reason this overview was so late in being published.
As you know I go over the numbers with a fine tooth comb and there is nothing in this report that indicates it's an illusion or "not real" and will magically improve. Those inventories I found really not a good sign for Q1 2013.
Imports and even exports are always revised almost wildly since exchange rates plus Census data comes in late. The price indices for trade I find beyond funky as well in terms of tracing through did someone make a killing by offshore outsourcing something and assigning to U.S. domestic growth sort of hidden values.
The entire report is really across the board bad news and bummer to rain on the super-rich Wall Street party like the rest of America doesn't exist.
Worst DOD drop since the Vietnam War
That's what I read - the decline in Defense spending was the biggest seen since the 1970s. I don't know if they are measuring this by dollars or percentage. What could be find out about this decline? If it is a relatively small number as a percentage of total Defense spending, then what is going to happen if we have to chop $100 billion or $200 billion off their budget? Maybe the problem here is that Defense is such a huge part of the economy that we can't afford to pare their budget without throwing the country into a recession.
OMB and DoD probably
and I can capture the figures from the GDP report via database queries.
Still waiting for "peace dividend" and reduction in DOD $
The reason the USSR fell was it simply refused to pare down its military spending despite the fact that it was crumbling internally - its industrial base was a sham. In addition, Afghanistan spending at the same time as it was trying to match Reagan's military spending brought it down. Massive military spending that refuses to come down, military personnel outside our borders, Afghanistan, crumbling industrial base = which country in 2013? Yeah, military spending may have to come down by a lot, but wasn't that the plan when we beat the USSR? Wasn't all that new money supposed to stay within the US and build bridges, roads, better schools, better power grids? Of course it was.
Yet DOD spending keeps up because there's always another war, always another threat, etc. If it comes down, so it comes down. Let that money not come out of taxpayers' shrinking pocketbooks in the first place, and if it is taken in taxes, then let those taxes be spent on butter and books, not guns and tanks. Examine the DOD spending, it's not like the personnel on the ground are pulling in big bucks. In fact, many of them require govt. assistance, struggle. So where's the money go? Why do contracts cost so much money, take so long to be implemented, suffer endless protests so everyone gets a piece of the pie or ties it up for years so they can share a piece of it? Cut it, because like the USSR from 1979 - 1989, and the Brits in the early 20th Century and the Roman Empire in the 4th Century, we cannot afford it anymore, especially when we have to borrow money from China to spend money on defense from China and adventures in Mali and elsewhere? Yeah, it's that obvious and ridiculous.
Initial claims (all is not well, hasn't been for a long time)
GDP contracting, initial claims up (forgetting completely about people never eligible for benefits and those that fell off the rolls) and the MSM says, "The number of Americans seeking unemployment benefits rose sharply last week but remained at a level consistent with moderate hiring." USA Today today's toilet paper edition. Oh, indeed, "moderate" hiring (actually dismal hiring for part-time gigs with no benefits), recovery (year 4 or 5 of this "recovery"), and all is well in the Land of Make Believe. Ignore again labor participation rates at lows not seen since 1981, all is well. There's lies, damned lies, and the MSM and government.
initial claims 38k increase
370k in initial claims does imply "moderate" hiring as in treading water hiring. I agree, the narrative by the press and especially politicians is to sweep the ongoing jobs crisis under the rug, along with the 20 million people suffering.
We don't cover initial claims right before the monthly unemployment report but also January is weird month for claims in terms of seasonal adjustment issues. This report is just so overweighted by the press in terms of economic indicators. They want it to be a real time short window indicator and it's just not as we repeatedly warn about.
Every single day more alienated Americans are being created
If the media spouts trash and government lies, and the government ignores the problem because its controllers want it that way and pay the politicians to do as their told (which runs counter to what the populace wants), I'm guessing an ever-increasing number of people that live reality just don't put too much trust in anyone outside their own small circle of friends and family. Over a few years, it doesn't take a PhD in Sociology or History to figure out that breeds a whole lot of hate and distrust. It's like Saddam's PR man facing a camera and stating, "All is well, we're beating the enemy." Nope, reality at one's door is more compelling.
misinformation minister
Well, at least so far government statistics are reasonably objective, but that also is under attack. Right, the politicians even hire economists who are....politicians.
It minimizes and ignores the people out there dealing with it
The consequences of these lies have terrible consequences. The people out there without gigs, or that have businesses that are failing, or are struggling to find their first or second or third job one or thirty years out of school need to see that someone in power does know the truth and does work tirelessly to fix it. If the people with the rare good jobs or pulling in big $ on Wall Street keep denying their pain and the reality they are dealing with, then the people without the gigs will blame themselves because that's the message - "everything's getting better, so what's your problem?" If the TV spouts the mantra, and some segment of society parrots it, then the burden increases. It leads those people to feel they screwed up, they are marginalized, and denied any sympathy. Especially without food lines, meetings, the advent of the Internet, it breeds isolation.
So should those denying the truth and marginalizing those suffering and blaming them be blamed themselves? Sure, why not, if they can be so callous towards other Americans, absolutely.