The Manufacturers' Shipments, Inventories, and Orders report shows factory new orders increased 2.8% for July. This is quite a turn around and new orders have increased two of the last three months, although May and June together were a wash, with +0.5% and -0.5% monthly changes in new orders respectively.
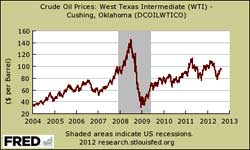
Nowadays the energy picture is confusing at best as the more information we are shown the more blurred our vision seems to become. Mixed messages, poor reporting and a media hungry to sensationalize anything it thinks can grab a headline have led to many wondering what the true energy situation is. We hear numerous reports on how the shale revolution will transform the energy sector, why alternatives are just around the corner, why advances in oilfield extraction techniques and new finds will help to lower oil prices. Yet no sooner have we read these rosy reports than we are bombarded with negative news on the Middle East, on why alternatives will never compete, on peak oil and declining oil production.
So where do we really stand? Is our energy future one of falling prices and plentiful supply or should we prepare for declining supply and sky high prices?
Consumer spending increased 0.4% from last month, in actual dollars and also when adjusted for inflation. Personal consumption expenditures are often called consumer spending by the press. Real Personal Consumption Expenditures, or PCE, are about 71% of GDP. Graphed below is the monthly change in consumer spending.
The BEA released corporate profits for Q2 2012 along with the GDP. Corporate profits after tax declined -1.4% from Q1 2012 to $1,648.3 billion. Corporate profits after tax are also up 13.3% from a year ago.
The June 2012 S&P Case Shiller home price index shows a 0.5% price increase from a year ago for over 20 metropolitan housing markets and a 0.1% change for the top 10 housing markets from June 2011. Not seasonally adjusted home prices are now comparable to July 2003 levels for the composite-20 and September 2003 for the composite-10.
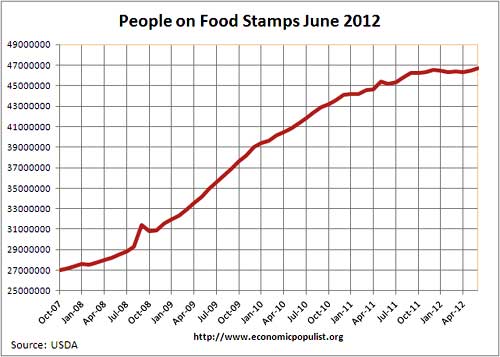
Think things are getting better? Think again. Food stamp usage is actually up from the latest data. As of June 2012, 46,670,373 people are on food stamps in the United States. That's 14.9% or less than 1 in 7 people are on food assistance. The United States population in June 2012 was 314,067,000 and this figure includes everyone, including people overseas. Food stamp usage increased 3.3% from June 2011 and 0.4% from May 2012.
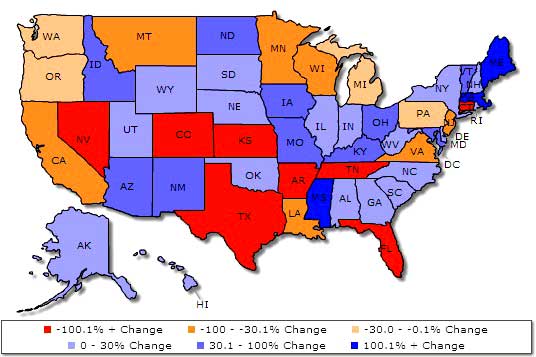
Every once in a while we see a piece of data which makes the hair on our heads stand on end. Such is the Census Foreign Trade graph of the month. Below are corn exports and their percent change a year from June 2012.
The more orange a state is, the more their exports declined. Texas corn exports declined a whopping -272.6%, Kansas dropped -160.9%. Arkansas is a real disaster, with a -445.2% drop in corn exports as of June 2012. What's worse is the June data only gives a 10% national drop in corn exports from a year ago. July gave much worse figures.
By July 2012, the United States corn export decline was the lowest in 19 years and had dropped 40% from a year ago according to the latest USDA statistics. The U.S. is the largest exporter of corn and corn is the largest export of course-grains. The below charts are from the USDA grain report.


 Welcome to the weekly roundup of great articles, facts and figures. These are the weekly finds that made our eyes pop.
Recent comments