
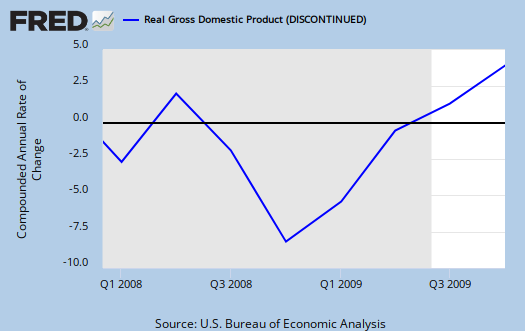
A 3rd estimate of Q4 2009 GDP was released Friday and the new revision is 5.6%, down from 5.9%. Here is the 2nd Q4 2009 GDP estimate and here is the initial report.
As a reminder, GDP is made up of:
where
Y=GDP, C=Consumption, I=Investment, G=Government Spending, (X-M)=Net Exports, X=Exports, M=Imports.
So, what changed? Here are the 3rd estimate numbers:
- C = 1.6%
- I = 46.1%
- G = -1.3%
- X = 22.8%
- M = 15.8%
In the first revision, those numbers were:
- C = 1.7%
- I = 48.9%
- G = -1.2%
- X = 22.4%
- M = 15.3%
So, as we can see the C, or consumption (PCE), which reflects demand, was down slightly in this revision, but the main change was in investments again. Investment also was down, which also reflects less demand. Note that changes in inventories accounted for 3.79 of the total 5.6% GDP growth. So, only 1.8% of the total GDP growth was due to other factors beyond changes in inventories.

The price index was also changed from 1.9% to 2.0%. (paid more means bought less in quantity).
On I we see the change in non-residential structures from -13.9 to now -18.0. Residential "I" (investment) dropped from 5.0 to 3.8. Both of these reflect the state of commercial real estate and residential.
Read a jaw dropping paragraph from the report:
Domestic profits of financial corporations increased $65.0 billion in the fourth quarter, compared with an increase of $82.8 billion in the third. Domestic profits of nonfinancial corporations increased $59.8 billion, compared with an increase of $27.6 billion.
In the fourth quarter, real gross value added of nonfinancial corporations increased, and profits per unit of real product increased. The increase in unit profits reflected decreases in both unit labor costs and unit nonlabor costs that more than offset a decrease in unit prices.
Ok, now what does that say? It says the Banksters, fueled with cheap Fed. zero interest loans and taxpayer funds, made more money than the producers of the real economy (ya know the people who make stuff). It also says profits by those who make stuff were done by screwing over their employees and firing them, plus reducing other costs. In other words, their profits didn't come from the good old fashioned practice of selling more of the stuff they made.
Subject Meta:
Forum Categories:
| Attachment | Size |
|---|---|
| 820.49 KB |
Question
I'm sure there is a formal term for this, but what I am witnessing is that seasoned employees that were laid off in 2009 are now being replaced by younger, less experienced workers (and lowering overall wages).
How does this play into increased "productivity'?
labor productivity
is output divided by hours in it's more simple form.
But output is revenues, so if they are squeezing workers, it would potentially show up as increased revenues in labor productivity. (as increased output, corporate revenues). (total revenues scaled by the industry price index). the hours are just that, the hours, not the actual wages.
I know in tech, they loved young people because they had no life and would work 24/7. Now that tech workers are older, hey are broke, and still have no life because they were busy being abused by the tech industry and didn't get one (some, many).
which is a good question if they report true hours or salaried and just take 40 hrs. because a lot of salaried are working 80 hours, not 40. TBI (to be investigated).
I think
we have to look at the PCE more closely. What are people buying?
In an insider-retail mag that I came across recently - all large retailers scaled back on store openings for 2009 EXCEPT the dollar stores and auto parts stores.
With the loss of manufacturing jobs, and the service industry slow to rebound, one has to wonder what is the catalyst for new jobs.
Also, is there any way to measure investment avenues? What are primary investment vehicles?
well from this document
and something weird is going on, I upload the actual reports from the gov. to this site and weird, they aren't showing up.
This is 2 today, so let me know if they aren't there. I do that because they are so hard to find, esp. after their release time period is up.
Anywho, looking at the BEA report, on PCE we've got:
a 2.5% increase in non-durable goods, a 0.4% increase in durable goods and a 0.2% increase in services from last quarter. 3rd quarter we had a blow out increase in durable goods. This is all in table 1. Then in terms of investments, I already listed a lot of those. Equipment & software really gained, 17.5% from last quarter.
Further breakdowns can be had from things like retail sales. The farthest breakdown is by NAICS codes. Feb. a bunch of people ran out and bought flat screen TVs and new fancy washing machines is what it looks like.
But GDP is adjusted by inflation, prices (real GDP) whereas retail sales is not.
What would be nice is a graph-o-rama on what sectors and services and activities make up what % of overall GDP.
I think PCE is about 78%. Investment is about ?? 11% currently.
Durable Goods and retail
According to this report ... on Feb durable goods
For retail sales ... looks like teens are shopping again
Street Insider: Feb. Retail Rundown: Same Store Sales Continue to Recovery
Retail Comp Sales
Just to point out that Feb 2008 retail comp sales were down .6 %
2007 to 2009 only rose 3.5%
on durable goods
I didn't really go into it that much for all I saw that really stood out was air-o-planes, non-defense. Those new orders are extremely volatile, obviously because they are million dollar I think some are billion(?) sales a pop.
Here is the EP write up on durable goods for 02/10.
Primary metals was up 2.2, capital goods also rose 5.4...I'd say that was a nice sign because that's basically business gear for the most part (stuff you need in running your business).
Calculated Risk on Residential investment
Has some detailed graphs on just Residential (link to post).
But I have hunted high and low for these updated tables CR claims to have found and I sure has hell can't find 'em.
So, I'm leaving the Residential info in this post as is.