
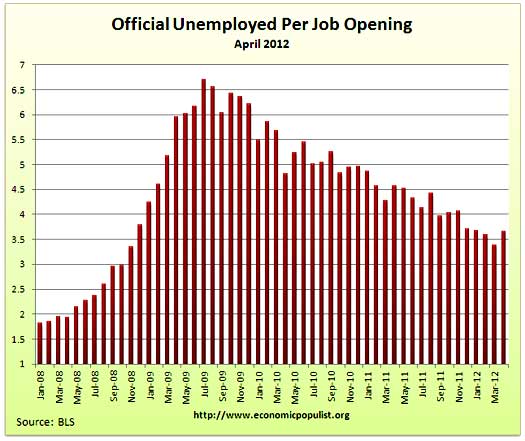
The BLS JOLTS, or Job Openings and Labor Turnover Survey reports a dismal and pathetic jobs market. The April 2012 statistics show there were 3.66 official unemployed persons for every position available*. There were 3,416,000 job openings for April 2012, a -8.69% change from the previous month of 3,741,000. Openings are still way below pre-recession levels of 4.7 million. Job openings have increased 56% from their July 2009 trough, yet opportunities are miles away from the 1.8 persons per job opening ratio at the start of the recession, December 2007. Below is the graph of April official unemployed, 12.5 million, per job opening.
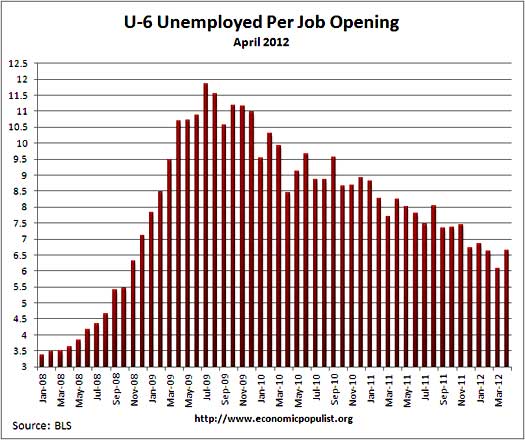
If one takes the official broader definition of unemployment, or U-6, the ratio becomes 6.65** unemployed people per each job opening for February. The April U-6 unemployment rate was 14.5%. Below is the graph of number of unemployed, using the broader U-6 unemployment definition, per job opening.
If you do not like the use of U-6 to look at the real number of people looking for a job to actual opportunities, consider this number. In April 2012, of those not in the labor force, thus not counted, 6,366,000 were actually wanting a job. The alternative U-6 unemployment rate only includes 2,363,000 of these people.
The rates below mean the number of openings, hires, fires percentage of the total employment. Openings are added to the total employment for it's ratio. The job openings rate dropped 0.2 percentage points from last month as did hires. The separations rate stayed the same. Within job openings rates government has a 1.5% job opening rate. This is lower than construction job opportunities, currently at a 1.6% openings rate. Bottom line it's just a really god awful jobs market.
- openings rate - 2.5%
- hires rate - 3.1%
- separations rate - 3.1%
- fires & layoffs rate - 1.3%
- quits rate - 1.6%
Below are raw job openings, still below the 4.7 to 4.3 million levels of 2007 and at a five month low.

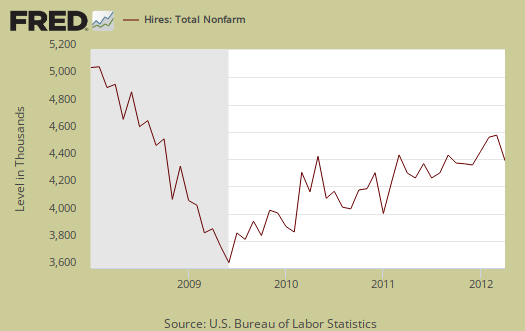
April hires were 4,175,000, a -3.69% change from March's 4,335,000 hires.
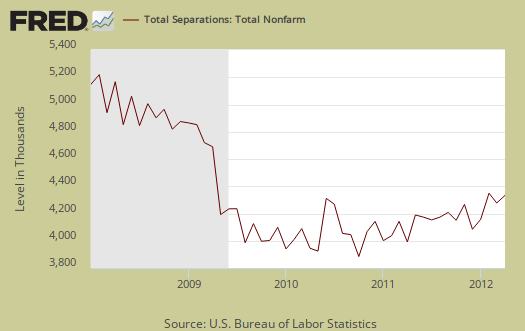
Below are total job separations, 4,086,000, a -1.94% decline from last month's 4,167,000. The term separation means you're out of a job through a firing, layoff, quitting or retirement. The report has a breakdown of separations, hires and openings across occupational categories. Layoffs and firings were 1,720,000 of the total 4,086,000 and to pre-recession levels.
Some of the figures from the JOLTS report reminds us of musical chairs in employment. The BLS is reporting a 1.8 million job gain over the past year. A 1.8 million overall job gain is pathetic considering the size of the unemployed. Officially, there are 12.5 million unemployed for April, unofficially the number is more like 27 million.
Over the 12 months ending in April 2012, hires totaled 50.9 million and separations totaled 49.1 million, yielding a net employment gain of 1.8 million.
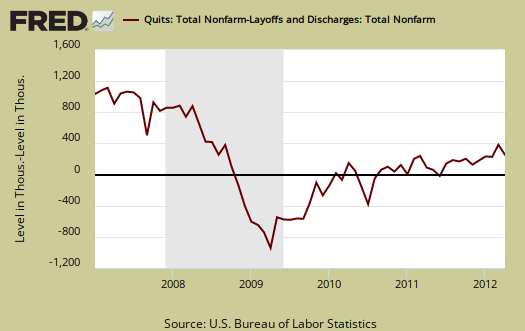
For April, of total separations, the quits were 50.7% whereas layoffs and fires were 42.1%. Graphed below are quits minus discharges and layoffs. The lower the bar on the below graph, the worse labor conditions are. When quits comes close to firings that means people have little choice in employment. You want to see choice, or quits, rise and be much higher than firings. The below graph shows people still do not have that many options when it comes to a job, for the ability to quit your job, shown in the number of quits, 2,070,000 for April, is still way below pre-recession levels of 2.8 million. The ratio of quits to firings, is nowhere near the 2009 mass firings and layoffs, yet the percentage job losses which were fires jumped in April and quits declined, yet another bad sign.
The JOLTS takes a random sampling of 16,000 businesses and derives their numbers from that. The survey also uses the CES, or current employment statistics, not the household survey as their base benchmark, although ratios are coming from the household survey, which gives the tally of unemployed.
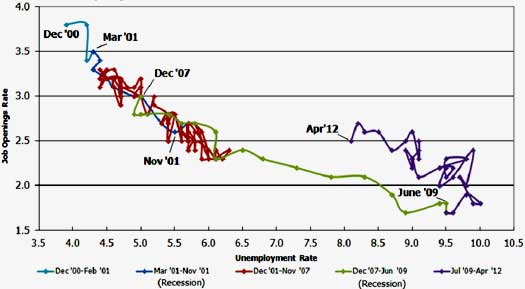
The BLS was kind enough to make a credible Beveridge Curve graph, reprinted below. The Beveridge curve shows the official unemployment rate vs. the job openings rate, over time. If you see a bunch of data points to the far right, that's bad, it means there is long term unemployment and not enough jobs. A right and up move in the Beveridge curve can indicate a skills mismatch. Look at how we're stuck to the right, but down, which means, pure and simple, there are not enough jobs. The green, representing the 2009 time period, shows how fast we went to the right and the purple, which is 2010-2012, means we are stuck in job market malaise.
The April 2012 unemployment rate was 8.1% and the rate down tick was mainly due to people dropping out of the labor force. This graph also refutes the corporate lobbyists claim there is a skills shortage per their cheap labor arbitrage agenda. We should note tech companies are notorious for putting out fake job openings with no intention of hiring as well.
The April 2012 statistics resulted in an almost vertical down move on the Beveridge curve. That's bad news. It's like the U.S. is permanently stuck, rolling around on the right side of this graph. Check out how awesome 2000 was for landing a job in the graph below.
JOLTS includes part-time jobs and does not make a distinction between part-time, full-time openings. A job opening reported to the survey could literally be take out the trash twice a week and be counted. This is a shame, it would be nice to know a little more about the quality of these new opportunities.
For the JOLTS report, the BLS creates some fairly useful graphs, one of which were reprinted here, and they have oodles of additional information in their databases, broken down by occupational area. Manufacturing job openings decreased by -62,000 in April. Government job openings decreased by -42,000. In fact there was not one sector of employers that showed an increase in job openings. The Saint Louis Federal Reserve also had loads of graphing tools for JOLTS.
Here is last month's JOLTS overview, unrevised.
*The BLS rounds up to 1 decimal place.
** is defined as the official unemployed plus people who are in part-time jobs for economic reasons plus the marginally attached. The marginally attached,
, are officially not part of the civilian labor force,
, and also not seasonally adjusted. The above graph was created by the seasonally adjusted levels of the unemployed, part-time for economic reasons and the marginally attached. The raw U-6 totals can also be calculated by this formula, which gives a slightly higher ratio of 6.653.
where
The reality is most of these "openings" are fake
Many, many corporations (and the USG) post job ads repeatedly for positions that will never be filled. The USG is notorious for posting fake ads on USAJobs to show that they are hiring, when in fact they will close positions within 24 hours or run the same ad repeatedly, close it, open it, close it, etc. because the preselected fool simply cannot get his way to the top of the candidate list so his friend can hire him. They will keep the hiring process going (or not) for literally 24+ months while applicants never hear word one while trying to secure a job and money to feed their families. Eventually, they might hear they didn't get it through an email. This goes on all the time. But people outside the specific office and USG think it's an actual opening they can fill - it's not. But hey, MSM runs stories "USGovt. hiring 100,000!" - complete lie.
Private sector - AMEX, as an example, is notorious for repeatedly running the same job ads over and over again. They will put candidates through 2-4 levels of interviews, testing, say they won't fill the position after all that, and then a few months later, it's open again and people that don't know better apply. Glassdoor.com and many other sites have the tales of woe.
The majority of companies do the same thing, and with 22+% real unemployment, the scammers and LIARS that post fake ads I'm sure are legion (not to mention the agencies that bait-and-switch, collect endless resumes, say they have a job and then reject an applicant within MINUTES), as tens of millions of Americans can attest.
This is part of the ploy and a necessary step to secure H-1B visas when "no qualified Americans could be found," maintain positive press in the MSM and to scare competitors, maintain budgets, and to keep HR busy pretending to do something instead of getting axed themselves. The charade also shows "competition" when everyone knows some idiot nephew or office sweetheart is being prepped for the job if only they could stop drooling on themselves long enough to secure it.
Hiring practices in the USA are a symptom of what's so wrong in this place and why the USG and corporations are not leaders or models in any sense of the words. If this country is going to change, the common man and woman that's been screwed over will have to take this beast by the throat.
"fake ads" are a huge problem
When I overview a statistical release, I try to just stick to the numbers but do try to make them "speak for themselves". That said, I saw the openings rate for "professional" positions being 4.2% and that includes STEM where we know there are many, many fake job ads.
Anyone who bothered to investigate knows this, or anyone in STEM knows this, but I'm fairly certain the JOLTS survey just takes businesses reported job openings at their word. i.e. they are not adjusting for employers claiming their are job openings when they are not hiring de facto or pushing tons of fake ads to bring over more foreign guest workers.
Why I mentioned it. i.e. you are right.
But, but, we simply cannot find any qualified personnel (LIE)
International company based out of USA advertised position, requires many years of experience, advanced degree, signing off on pretty important things (so you're on the hook if things go wrong), setting up corp. programs, etc. Pretty standard work for a qualified full-time worker with degrees and experience in the field. Nowhere does ad say part-time, in fact, clearly a full-time job with full-time duties. Well, lo and behold, bait-and-switch, HR during screening phone call reveals it's PART-TIME in first 10 seconds and says lots of words in ad, so candidates miss it (lie, ad never says that and candidates know how to read and apply to jobs)?! This job is not in a city of 1,000,000 so no way people are moving down there for part-time work. So what's the game? Probably fishing for resumes, pressuring current workers to work harder or someone in local area/friend preselected for gig. But HR can say they solicited and received 1000 resumes from national candidates, stiff competition. No written record of switch, welcome to the USA of lies and bait-and-switch. Wonder why people hate HR and companies? There shouldn't be any doubt. Build up your hopes so you can join a crew that has no problems being deceitful. Would you trust these people with your medical benefits or paycheck? Would you want to ever apply there again or buy anything from them ever? In some ways I'm glad Indians and Chinese overseas can deal with this crap - have at it.
JOLTS "the sky is falling" reactions
Folks, this could be due, in part to the bizarre hot winter weather, hiring happened earlier. That said, the jobs market has ALWAYS been crappy, none of this should be so shocking and the numbers to really compare against are 2007 and then 2000, the last year the job market was good. People will say oh, it's just because March was so good. Well, check out our link to March's overview and bottom line, March still sucked for job openings. Seriously, we must compare to 2007 and 2000 and why that Beveridge curve the BLS provides is included in our overviews.
I just read some other reports where people believe somehow this is news. Well, yes, there was a dramatic decline in job openings, but the change, really just indicates more labor malaise that has been going on for way too long now, not some dramatic change from the crappy status quo.